ZOTAC GeForce GTX 1660 Compute Related Benchmarks
We are going to run the Zotac GeForce GTX 1660 through some benchmarks to see if the removal of RTX features and some compute capacity hurts the card significantly. On the other hand, it carries a lower price than the lowest-end “RTX” card we have reviewed, the ASUS Turbo-RTX2060-6G. If it is close to the same compute performance, it may be a better value.
As we continue to keep our graphics card benchmarks updated we have added the AMD Radeon Vega Frontier Edition results to several charts. In addition, we added a new benchmark called hashcat64 to test password cracking performance, another common application for GPUs.
Geekbench 4
Geekbench 4 measures the compute performance of your GPU using image processing to computer vision to number crunching.
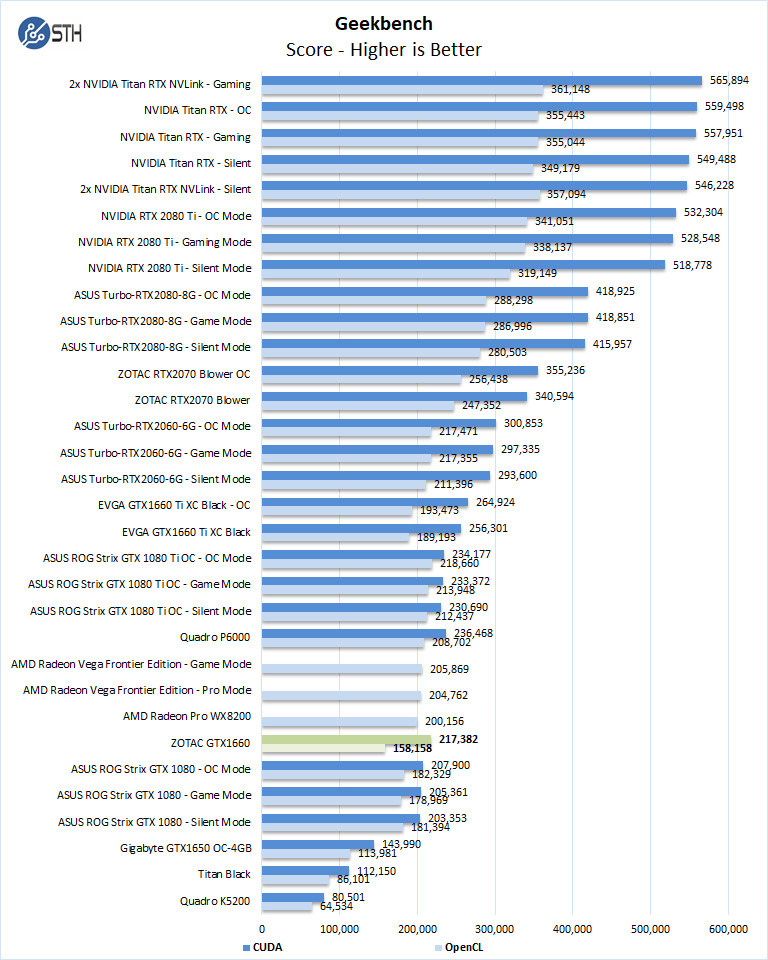
Our first compute benchmark we see the Zotac GeForce GTX 1660 shows performance similar to GTX 1080 results which is extremely solid. The GTX 1660 is a lower-cost product.
LuxMark
LuxMark is an OpenCL benchmark tool based on LuxRender.
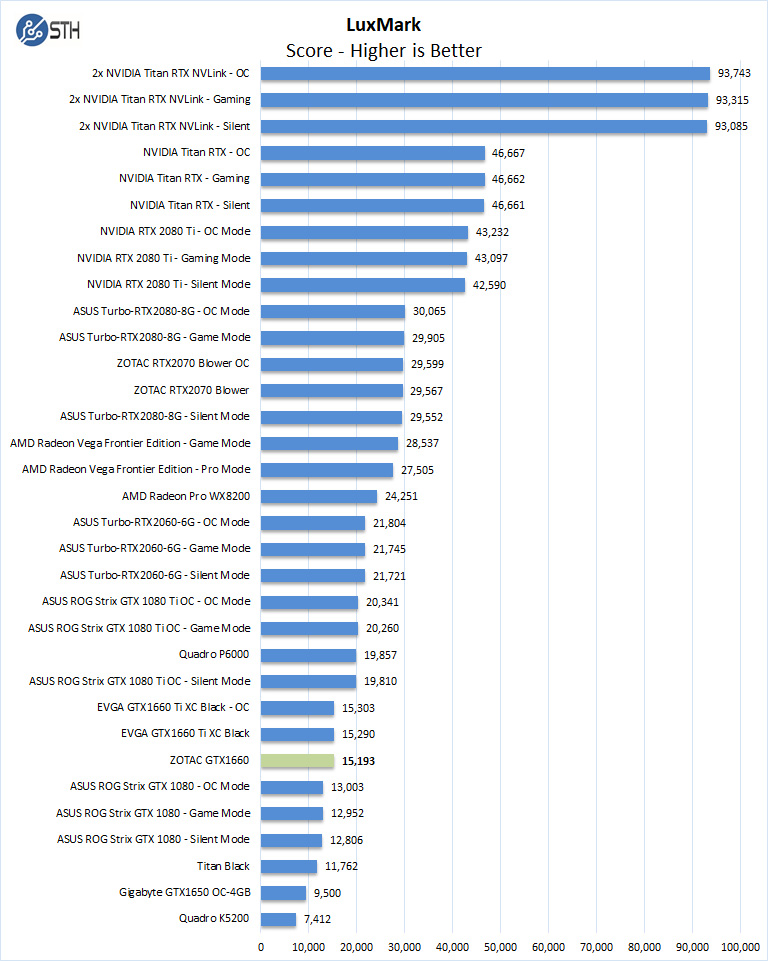
Here we again see performance above that of the GeForce GTX 1080 results. One of the other key themes we will see here and in other tests is that the performance scales well with dollars spent.
AIDA64 GPGPU
These benchmarks are designed to measure GPGPU computing performance via different OpenCL workloads.
- Single-Precision FLOPS: Measures the classic MAD (Multiply-Addition) performance of the GPU, otherwise known as FLOPS (Floating-Point Operations Per Second), with single-precision (32-bit, “float”) floating-point data.
- Double-Precision FLOPS: Measures the classic MAD (Multiply-Addition) performance of the GPU, otherwise known as FLOPS (Floating-Point Operations Per Second), with double-precision (64-bit, “double”) floating-point data.
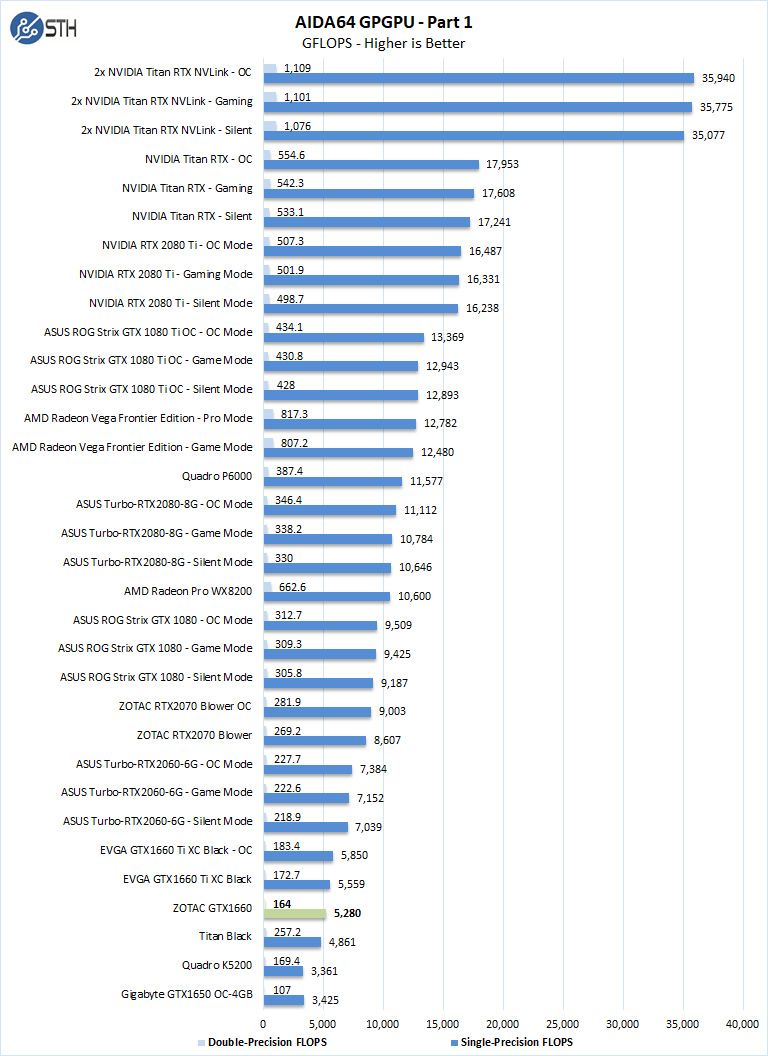
Here, one can see the Zotac GeForce GTX 1660 fall between the NVIDIA GeForce GTX 1660 Ti and the GTX 1650, right where we would expect.
The next set of benchmarks from AIDA64 are:
- 24-bit Integer IOPS: Measures the classic MAD (Multiply-Addition) performance of the GPU, otherwise known as IOPS (Integer Operations Per Second), with 24-bit integer (“int24”) data. This particular data type defined in OpenCL on the basis that many GPUs are capable of executing int24 operations via their floating-point units.
- 32-bit Integer IOPS: Measures the classic MAD (Multiply-Addition) performance of the GPU, otherwise known as IOPS (Integer Operations Per Second), with 32-bit integer (“int”) data.
- 64-bit Integer IOPS: Measures the classic MAD (Multiply-Addition) performance of the GPU, otherwise known as IOPS (Integer Operations Per Second), with 64-bit integer (“long”) data. Most GPUs do not have dedicated execution resources for 64-bit integer operations, so instead, they emulate the 64-bit integer operations via existing 32-bit integer execution units.
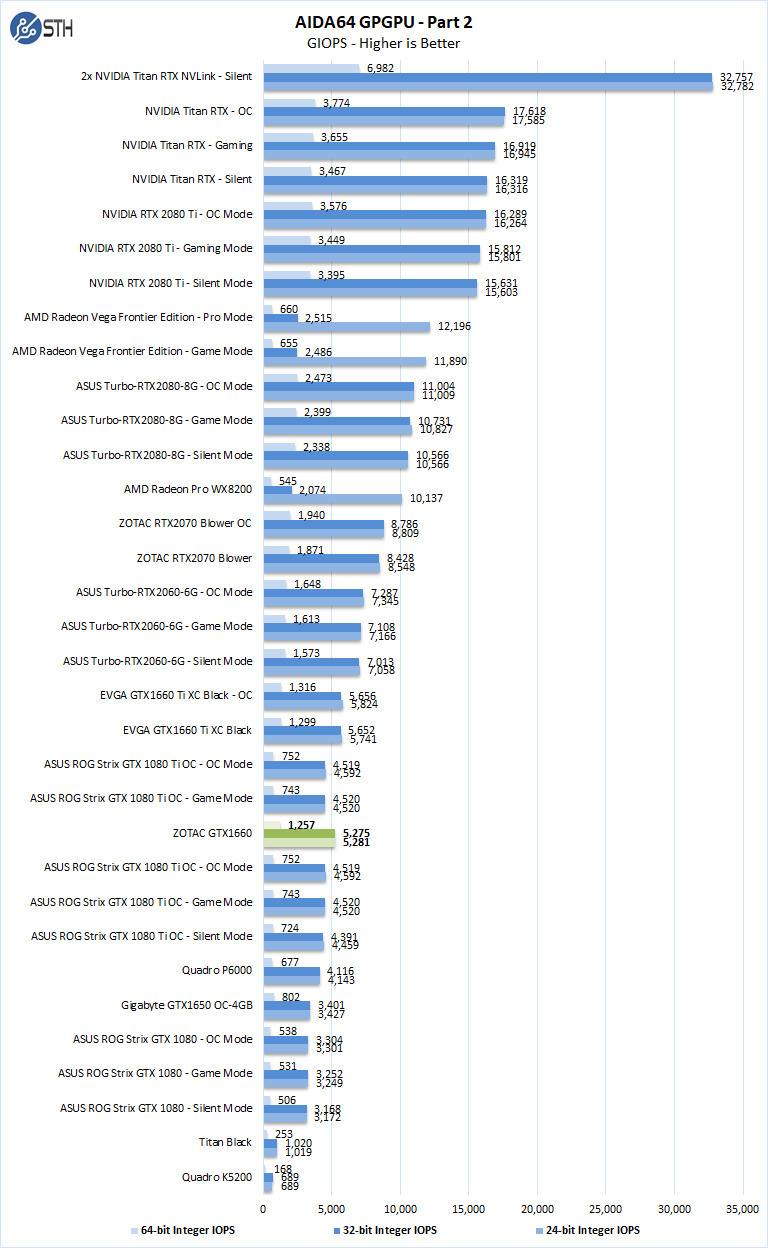
The take away here is the Zotac GeForce GTX 1660 performs at rates above GTX 1080 Ti and just below the GTX 1660 Ti OC. This is an extremely impressive result.
hashcat64
hashcat64 is a password cracking benchmarks that can run an impressive number of different algorithms. We used the windows version and a simple command of hashcat64 -b. Out of these results we used five results to the graph. Users who are interested in hashcat can learn more here.
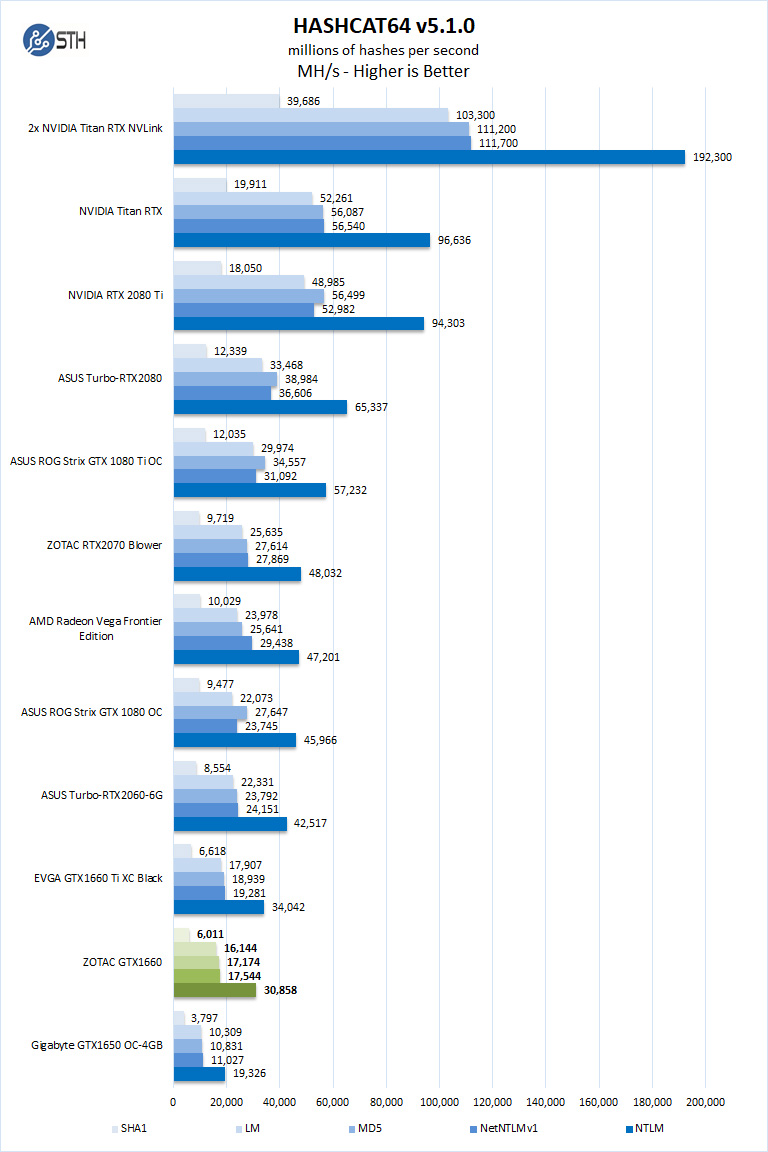
Hashcat64 is a demanding benchmark which heats up GPU’s, here we see the GTX 1660 fall were we would expect it to, between the GTX 1660 Ti and GTX 1650. If you want to see higher-end hardware examples, check out 1U of Password Cracking Fury: 4x NVIDIA GTX 1080 Ti in 1U Performance which we did years ago.
SPECviewperf 13
SPECviewperf 13 measures the 3D graphics performance of systems running under the OpenGL and DirectX application programming interfaces.
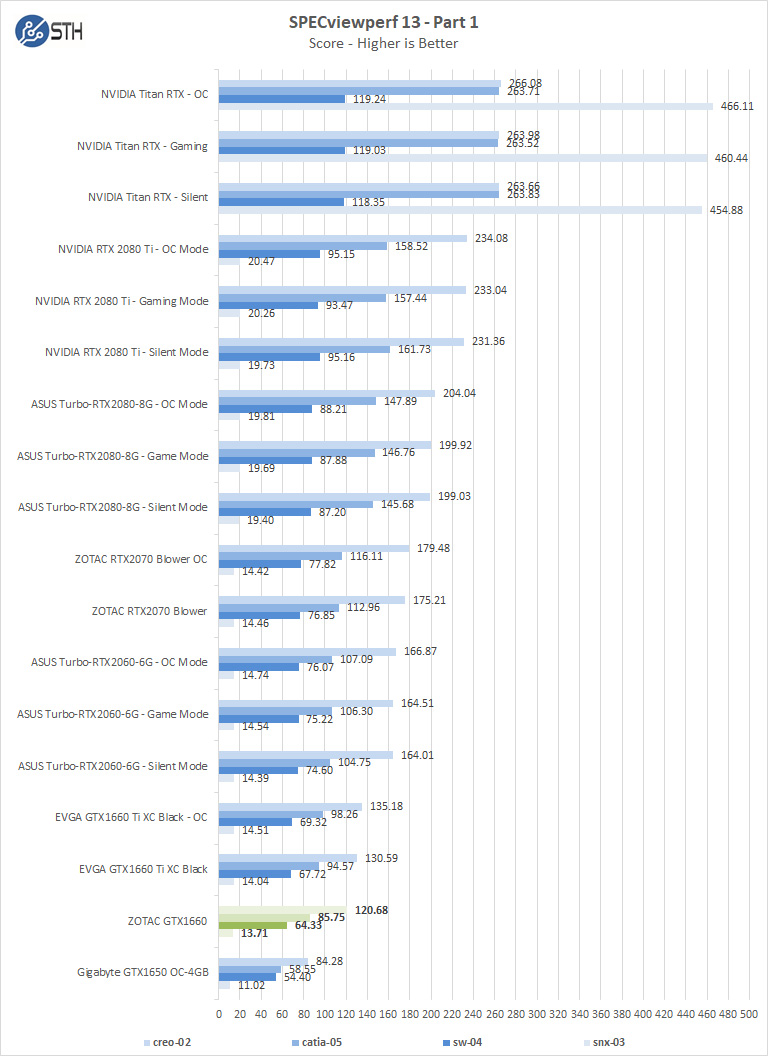
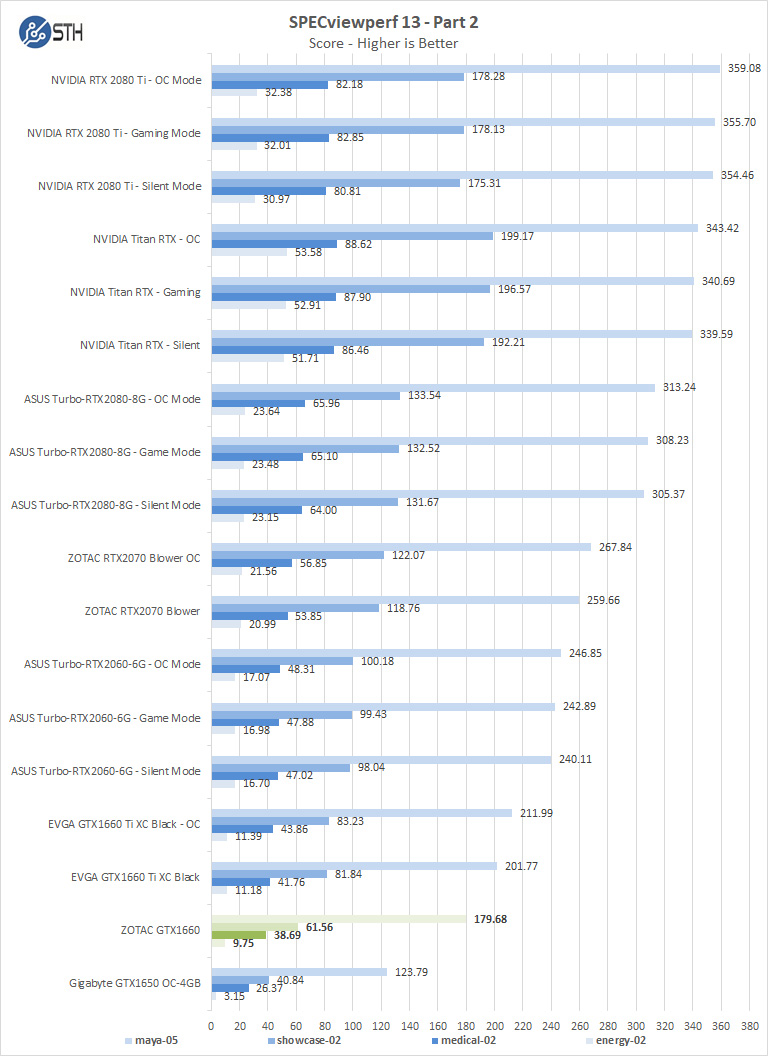
Again we see the Zotac GeForce GTX 1660 fall were we would expect to see it on our charts. One can also see that there is great performance uplift over the GeForce GTX 1650.
SPECworkstation 3
SPECworkstation3 measures the 3D graphics performance of systems running under the OpenGL and Direct X application programming interfaces.
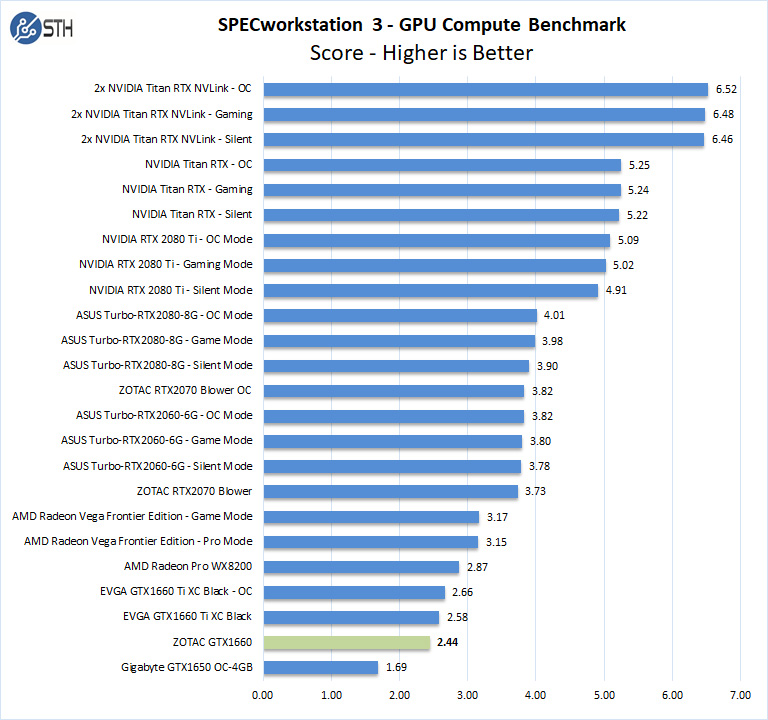
This is more of the same. There is a fairly enormous delta between the GTX cards and the first generation of RTX cards here.
Let us move on and start our new tests with rendering-related benchmarks.


Some of these pictures seem to be from a Gigabyte 1650 and not this GPU?
95% of the content on this site is solid, but many of these “reviews” leave me scratching my head. Did no one look at these benchmark charts and realize that comparing a budget card to 15 high end cards and a couple of Kepler cards was incredibly unhelpful? This card is at the bottom of every benchmark! Why not compare it to cards in its range, I.E. 1060 and 1070? I mean this is the type of stuff you learn about in an intro stats class.