Intel Xeon 6980P Performance
Full disclosure on this one. We had a pre-production server for days, not weeks. As a result, many of our benchmarks that take a day or more to run are just not possible.
We noticed that 100Gbps per CPU was not enough for our application-level benchmarks. Instead, we are now using around 400Gbps of networking per CPU because that is important.
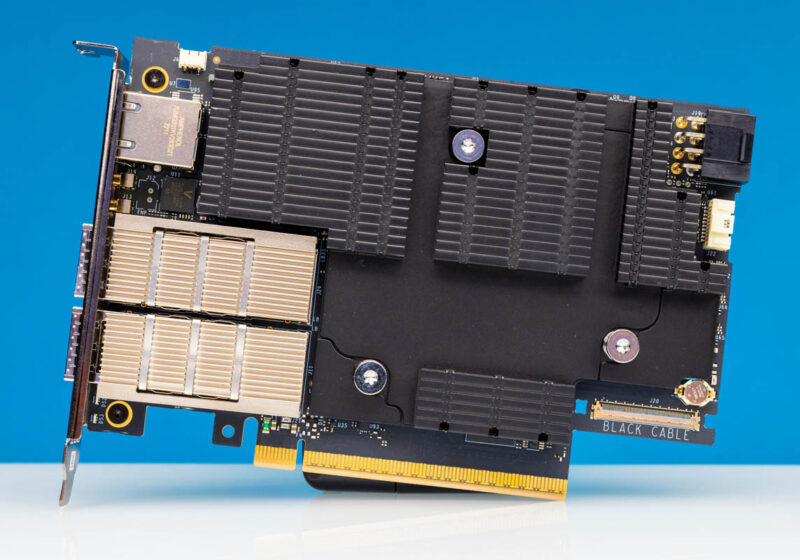
Thank you to NVIDIA for sending its NVIDIA BlueField-3 DPUs that we have featured a few times and used here to provide additional network throughput. These are very high-end cards and a step up from the company’s NVIDIA ConnectX-7 in terms of features.
Python Linux 4.4.2 Kernel Compile Benchmark
This is one of the most requested benchmarks for STH over the past few years. The task was simple: we had a standard configuration file, the Linux 4.4.2 kernel from kernel.org, and made the standard auto-generated configuration utilizing every thread in the system. We are expressing results in terms of compiles per hour to make the results easier to read.
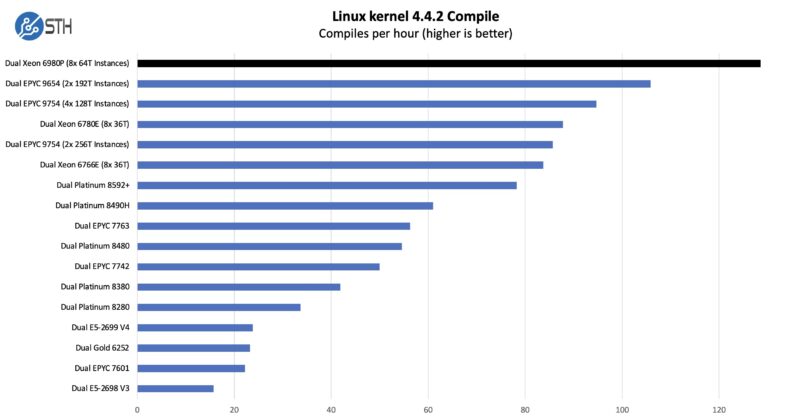
This one is really neat. There are brief single-thread segments during this workload. What we found a few years ago is that as the core counts scale, we get more compiles per hour by splitting the workload up into multiple instances running in parallel. The new Xeon 6980P just has lots of cores, cache, and memory bandwidth, so it does well here. We might be able to get a bit more performance by splitting the workload to 42/43 core instances to align to the structure of the chip, but we ran out of time for this review.
c-ray 1.1 Performance
We have been using c-ray for our performance testing for years now. It is a ray tracing benchmark that is extremely popular for showing differences in processors under multi-threaded workloads. Here are the 8K results:
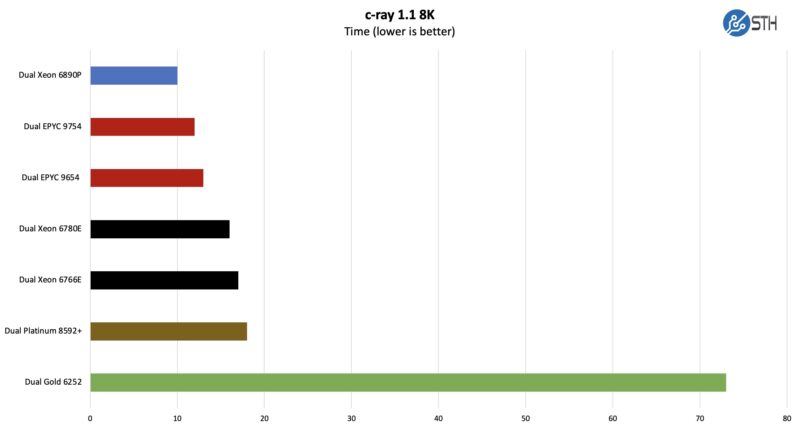
This is so much fun. We built this back in the day when we thought an 8K render size would be more than we would ever need. Systems would take tens of minutes to do a single run. Now, we need something much bigger since we are seeing differences, but we are losing fidelity.
When we talk about how the new chips are so fast that they are really designed for running multiple workloads at once, this is a great example.
STH nginx CDN Performance
On the nginx CDN test, we are using an old snapshot and access patterns from the STH website, with DRAM caching disabled, to show what the performance looks like fetching data from disks. This requires low latency nginx operation but an additional step of low-latency I/O access, which makes it interesting at a server level. Here is a quick look at the distribution:
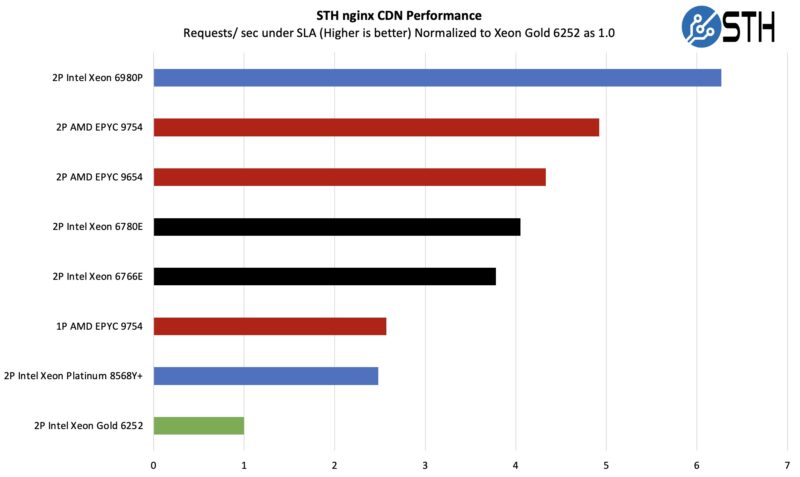
Here, we are seeing a familiar pattern. There are a few items to note, though. The Intel CPUs are doing really well. We are not, however, doing Intel QAT offload for OpenSSL and nginx. If you do not want to use acceleration, then this is a good result. If you are willing to use accelerators, then this is not ideal since there is silicon accelerators not being used. It is like not using a GPU or NPU for AI acceleration.
See Intel Xeon D-2700 Onboard QuickAssist QAT Acceleration Deep-Dive if you want to see how much performance QAT can add (albeit that would only impact a portion of this test.)
Even without QuickAssist and looking at cores only, Intel is doing really well.
MariaDB Pricing Analytics
This is a very interesting one for me personally. The origin of this test is that we have a workload that runs deal management pricing analytics on a set of data that has been anonymized from a major data center OEM. The application effectively looks for pricing trends across product lines, regions, and channels to determine good deal/ bad deal guidance based on market trends to inform real-time BOM configurations. If this seems very specific, the big difference between this and something deployed at a major vendor is the data we are using. This is the kind of application that has moved to AI inference methodologies, but it is a great real-world example of something a business may run in the cloud.
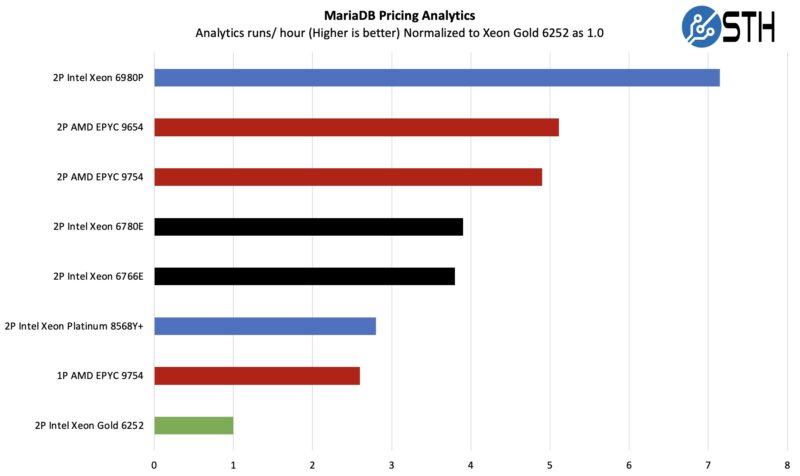
What is interesting about these non-microbenchmark and ultra-scalable workloads is that we are starting to run into non-CPU bottlenecks. We might have to split this into multiple instances to keep it scaling in the future.
STH STFB KVM Virtualization Testing
One of the other workloads we wanted to share is from one of our DemoEval customers. We have permission to publish the results, but the application being tested is closed source. This is a KVM virtualization-based workload where our client is testing how many VMs it can have online at a given time while completing work under the target SLA. Each VM is a self-contained worker. This is very akin to a VMware VMark in terms of what it is doing, just using KVM to be more general.
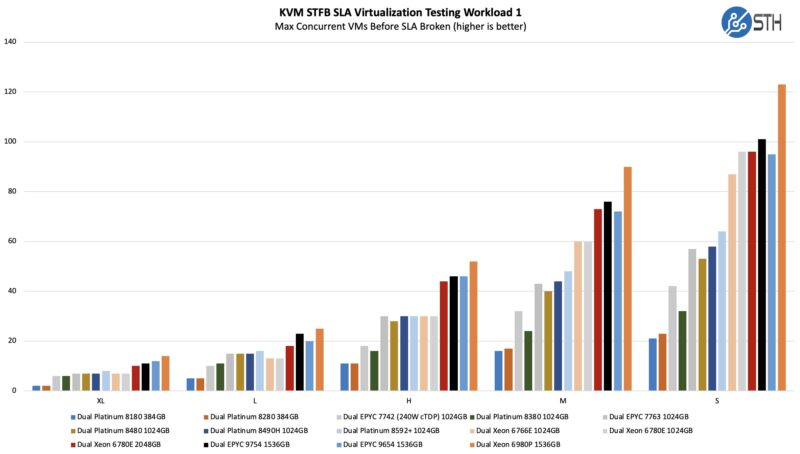
Although Intel’s E-cores do well here, the P-cores with Hyper-Threading help a lot, which is why this new chip does so well. Intel is just getting enormous generational gains here.
Since we had limited time, and only one CPU configuration, let us talk a bit about what Intel showed for its charts.
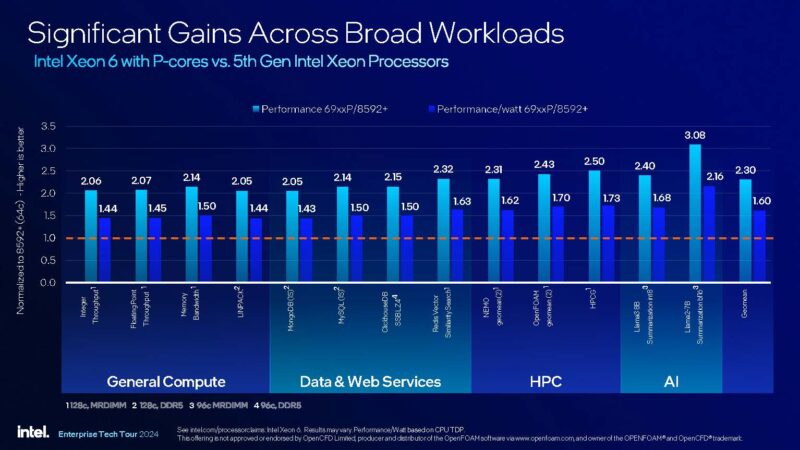
Intel’s Performance View of Intel Xeon 6900P
By doubling the core count, Intel can double its performance, plus get a bit more from architectural improvements. Perhaps the more notable part here is that, although the TDP is increasing from 385W to 500W, by doubling the core count and performance, it is getting much higher efficiency.
Intel also showed it is extremely competitive with both of AMD’s top-end Genoa/ and Bergamo parts. Of course, AMD said its Turin processors are launching next quarter so this will change.
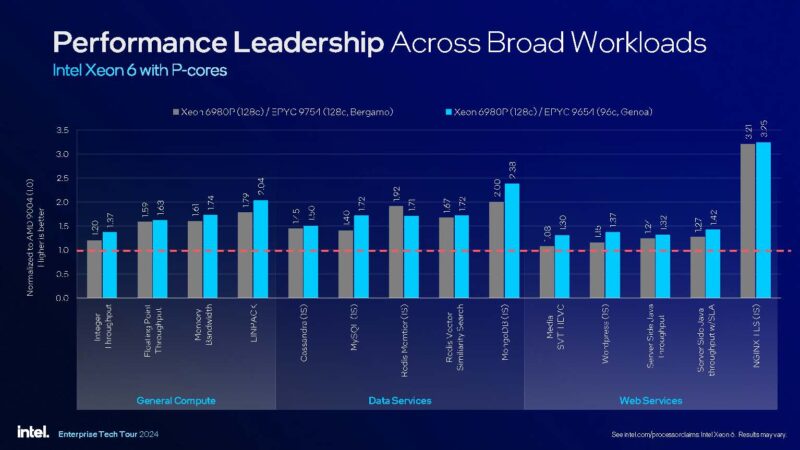
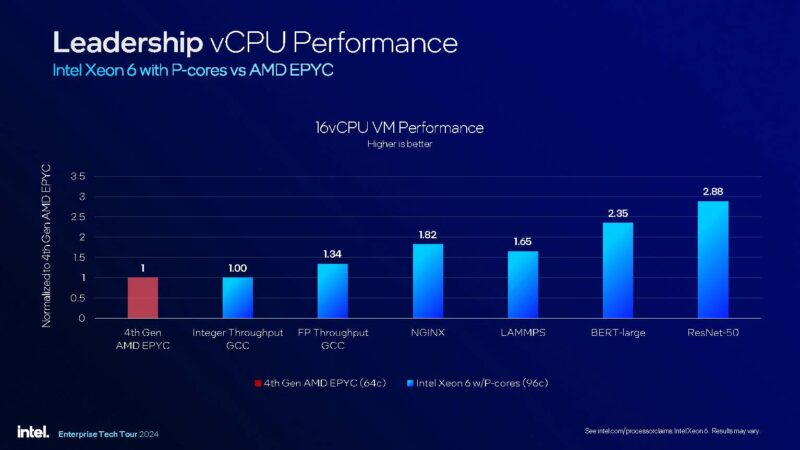
Intel had a really cool benchmark here. At first, you might look at this and think this is 64 core EPYC Genoa to 96 core Xeon Granite Rapids-AP so things are way off. What Intel is actually doing is using a 16 vCPU VM and measuring performance while all of the rest of the cores are being utilized around 50%. So this is 16 vCPU to 16 vCPU just using different parts. If Intel had used a 96-core EPYC Genoa vs. a 96-core Xeon, it might have optically looked better, but then it would be using a top bin versus a not-top bin part, which would skew TDP/ core. Perhaps the more exciting thing is that this type of benchmarking is happening at all.
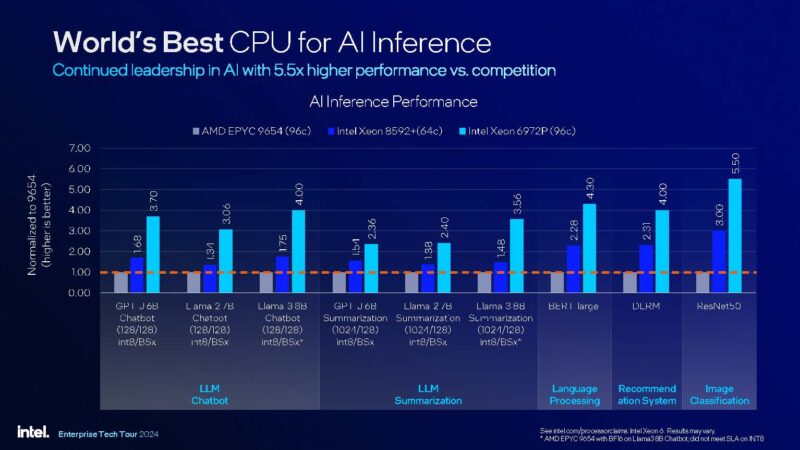
Of course, since everything is AI, and Intel has not just VNNI but also AMX for AI acceleration, it does very well at AI inference.
Many HPC workloads are memory instead of compute bound. This is where having fast DDR5-6400 and also 8800MT/s MRDIMMs helps a lot.
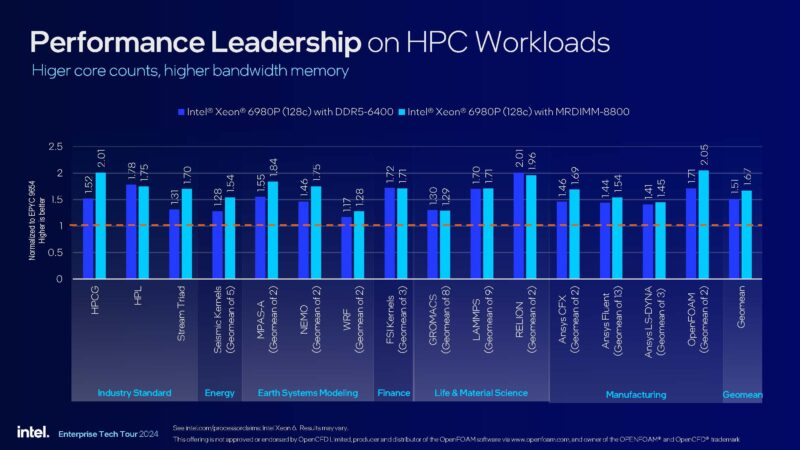
Simply adding double the number of cores along with 12 channels of faster DDR5 memory really helps Intel here. It has a leadership part on a per-socket basis. If we had a lot more time, we probably could find a few workloads that simply run better on Zen 4c cores due to microarchitectural fit, but the story is simple: Intel is back in the performance leadership position for now.
Next, let us talk a bit about power.


Wow can’t even hide Patrick’s love affair with Intel anymore can we ? Intel has not even properly launched this but yet it’s 128c Intel vs 96c Genoa, but AMD will have same 128c in 2 weeks time……just be honest finally and call it servingintel.com ;-)
Yawn… Still low on PCIe lanes for a server footprint when GPUs and NVME storage is coming fast and furious. Intel needs to be sold so someone can finally innovate.
Whether love or not, the numbers are looking good. For many an important question will be yield rates and pricing.
I wonder why Epyc is missing from the povray speed comparison.
One thing I’d like to see is a 4-core VM running Geekbench 6 while everything else is idle. After that Geekbench for an 8-core VM, 16-core, 32-core and so forth under similar circumstances. This sort of scaling analysis would help determine how well balanced the MCRDIMM memory subsystem is to the high-core-count processors–just the kind of investigative journalism needed right now.
As an asside, I had to work over eight captchas for this post.
The keyword would be availability. I checked just now, and these newer parts don’t have 1k Tray Pricing published yet. So not sure when would they be available. It felt painful to restrict the On-Premise Server procurement specification at 64 cores to get competitive bidding across vendors. Hope for the best.
It is hard not to get excited about competition, Intel has finally done it, they launched something faster than AMDs previous generation… Intel’s focus on AMX accelerations seems to have paid off, I guess we shall see when Turin launches in a few weeks.
@Patrick how do you manage to call ~53GB/S “closing in on” ~330GB/S? Even dual GR is slower by a factor of three.
Well there’s 90 minutes of my life well spent. I’d like to thank Patrick and the STH krew on this one.
Rodigas I didn’t get that sense at all. Intel’s the first to launch a 500W TDP part on a modern process and they’ve got cores and memory bandwidth so they’re winning for now. In Q4 when Turin is out we’ll say he loves AMD. It’s shaping up like Intel will at least show it’s competitive with Turin. That’s great for everyone.
Eric O – I’d like to see GB5 not 6. You’ve hit it before, GB6 is useless even for workstation class multicore.
Ram is right, these aren’t really available yet. Paper launch, or HyperScale only launch.
Emerth do you mean that 543391MB/S is much more than 330GB/S? The screenshots in the memory section show Intel’s far ahead. With MCRDIMMs adding 38% more bandwidth they’re getting close to 750GB/s on one CPU. So maybe they meant to say the Grace dual chip is almost up to a GR MCRDIMM single chip?
Intel’s doing a fine job. I can’t wait for 18A chips.
@RamShanker & francis:
– ASUS has a webpage up; search for ASUS “RS920Q-E12”, not quite for sale yet, but there’s a PDF.
– NextPlatform has published a guesstimate of 6980P U$24,980 and 6979P U$24,590; with lower prices for trays. Prices are fairly meaningless ATM with the competitor’s launch imminent.
> Intel is differentiating on things like features depending on the core type and SKU
Glad for the competition, but really wish they’d simplify the stack of SKUs. Is Intel On Demand gone?
Did Intel say why all the black ink on that Clearwater Forest chip?
That seems to be a very risky chip … gaa/bspd/hybrid bonding,18A all being introduced in the same chip. Did they actually demo one?
Never thought I’d see a vulture capitalist group (Apollo Global Management) investing in Intel. I thought Gelsinger was supposed to be Intel’s savior?
As others have pointed out, these seems a bit bias on the Intel side of things.
Yes, we’re all glad to see them finally getting their house in order and competing, but do better on containing your fanfare.
Wow. So many haters claiming bias. Go back and re-read the linked epic Rome review from 2019.
When I compare that to this one and all I see is that good products get good reviews (this one) and great products get great reviews (Rome). I also noticed how thankful Patrick is to have intel be competitive in the top of the line, which it is with this latest launch and how awesome it was back in 2019 to have AMD jump out and surpass intel just a few years after they were nearly bankrupt.
For detailed benchmarks I refer all to Phoronix – but a very nice piece by ServeTheHome.
many thanks, L
So, different kinds of “leadership” …
According to Micheal at Phoronix this year’s Intel 6980P is 12% faster than last year’s AMD 9684X.
But, the 6980P has 700 TDP and the 9684X has 400 TDP (while remembering that comparisons of their TDPs isn’t exactly equal) and AMD costs U$10K less. So, 75% more TDP and 5x more $ (unfairly comparing guestimated MSRP vs discount pricing). With the new Turin (coming RSN) offering moar Coors and a big bump over AMDs last generation; in the same socket.
Making a tortoise and hare comparison would be confusing as to who is who and who is ahead at a particular point in time.
We appreciate the effort it takes to put together these articles and enjoy reading them; except for the shameful core latency mushy pea soup image, while other sites has tack sharp puny numbers and a reasonable sized image file nonetheless.
I need Intel to go up so I can give Grandma her retirement back…
We all know Turin is coming. At least AMD now needs to push really hard instead of just coasting because Intel’s been so far behind. Let Intel have its weeks at the top.
On the plus Epyc now has some competition coming. The one big pain point will be software licensing where it’s licensed per Core.
What is up with that lscpu output for the SNC3 configuration? It reports:
Node 0: 43 threads
Node 1: 43 threads
Node 2: 73 threads
Node 3: 86 threads
Node 4: 86 threads
Node 5: 84 threads
And then threads 256-352 are completely unaccounted.
@emerth: I see 0.5TB/s in stream on 128 cores while NVLD seems to go to 0.6 TB/s — so I’d agree with “closing” here.
Intel fanboys forgot AMD Turin with 192 cores? That is always the case, Intel concentrated for quarter year profits instead of keeping R&D on good shape. Now better to concentrate selling factories to someones that need “old school” stuff. Game over. There could be some ligth if they could boost soon out 256 c, which is very unlikely. AMD will do it soon anyway, most likely minor change to just add 20 % more cores. But fanboys are fanboys and always forgotting the truth.