SSD Endurance Insights
In terms of drives, we used a lot of Intel (which is now Solidigm) drives. For whatever reason, we just got a ton over the years as they have been reliable for us. Also, we are going to be using a lot of averages here when we talk about the amount of data written since in presenting over 1000 drives we want to see the trend of how people are using them.
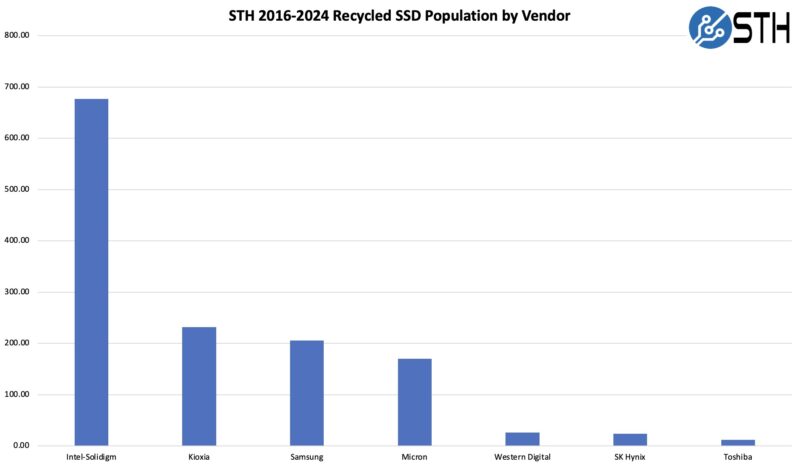
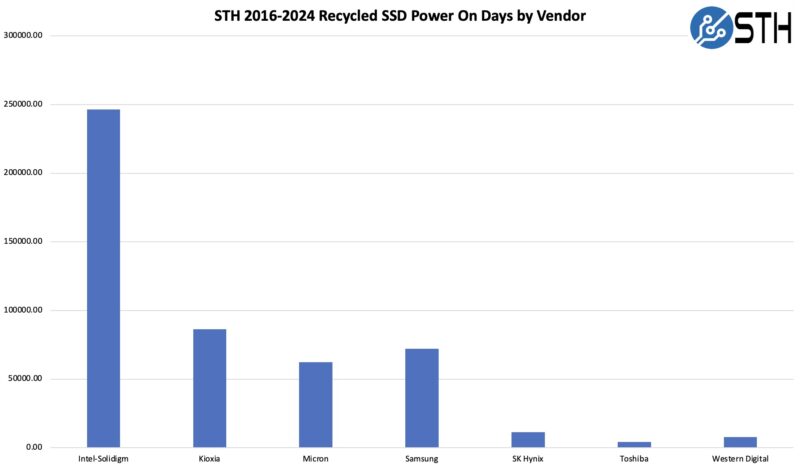
Since we have the most drives, it is worth noting that the Intel-Solidigm drives have the most recorded power on hours and days.
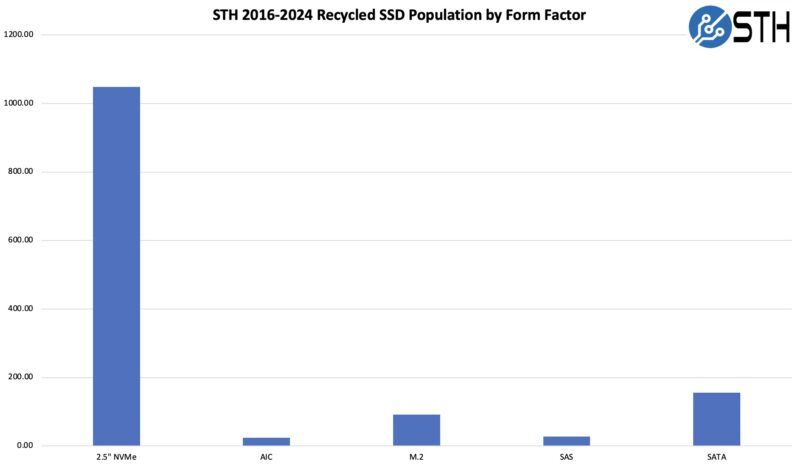
The vast majority of our drives come in 2.5″ form factors. We had a handful of PCIe add-in cards for specific projects. There were also a few SAS drives for some servers that used legacy SAS storage arrays. The M.2 drives were a bit lower at just under $100 here. One of the big reasons is that we often purchase boot M.2 devices new since drives like the SK Hynix P31 tend to be low power and good boot devices for us. On the SATA side, back in 2016-2018, it was more common for us to get systems that had SAS/SATA bays, and often we filled those bays with SATA rather than SAS drives.
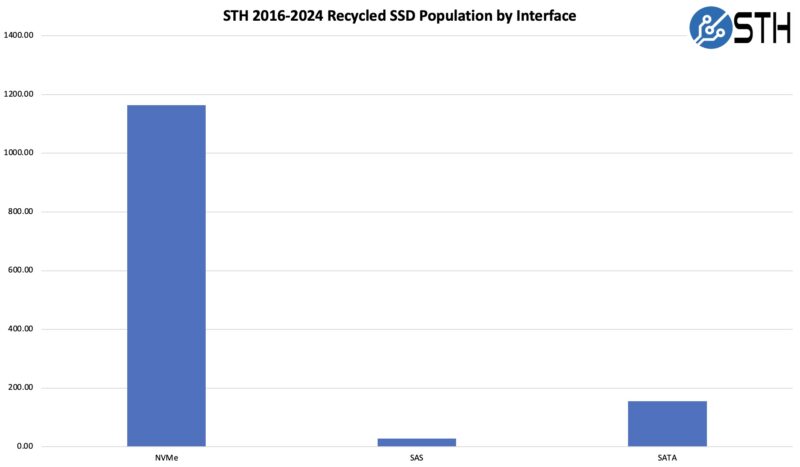
All told, here is the NVMe, SAS, and SATA breakdown.
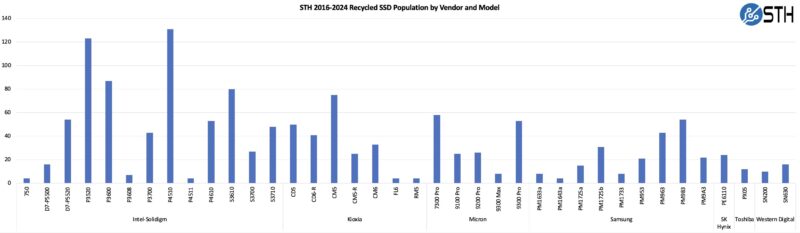
With our 1347 drive population, we have a few slices of the data. First, here are the model lines that we use. As a quick note, we may use different drive form factors on the same lines (e.g. AIC and U.2.)
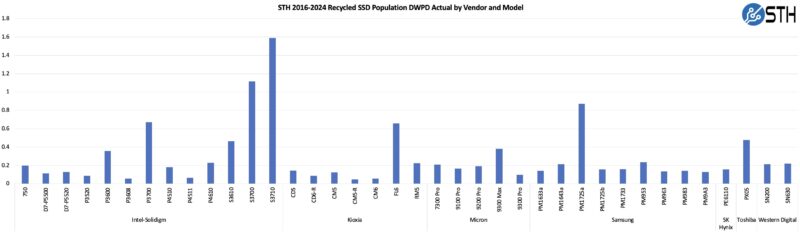
If you just want the high-level view on what we saw dividing the total amount written to a drive by the power on hours to get the “DWPD Actual” figure, or what the previous owners actually used in terms of drive writes per day, here is what that looks like by model.
Of those drives, we looked up the endurance ratings, and there are a few buckets. We thought differentiating between a 10 DWPD drive and 60 DWPD drive was not overly useful. Instead we just called that a >3 bucket. Most of the drives we used were 1-3 DWPD, which is more a sign of where the industry moved over the years.
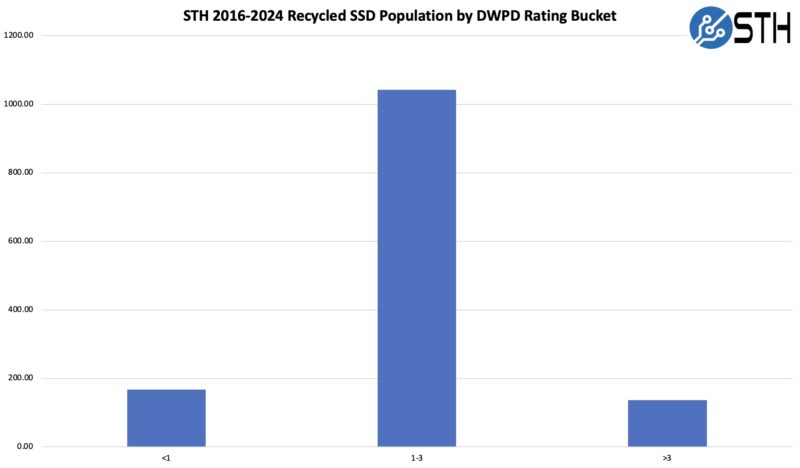
Of course, this is more of a reflection of our purchasing preferences rather than necessarily being a broader market commentary. Part of this is that we felt like buying higher DWPD used drives was safer than buying used ultra-low endurance drives.
When we looked at how much was actually written to drives, the numbers were much lower than even our main buckets. The majority of actual workloads ran under 1 DWPD of writes, and of course, they could have been sequential writes rather than random 4K writes.

Armed with how much data was written to the drives over a time period before we received the drives, and the ratings, we can then take an average of the actual drive writes per day to the rating. As you can see, really only the 0.2 DWPD Intel 750 drives were anywhere near their ratings.
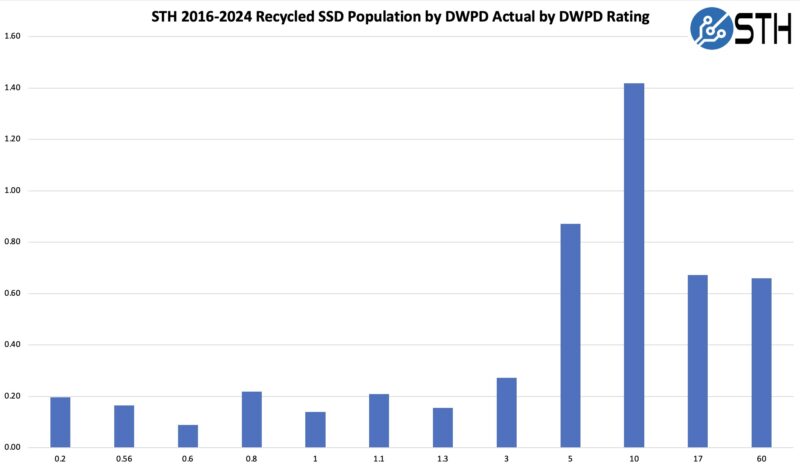
While cresting 1.4 DWPD may be exciting, in reality, that average was mostly done on smaller 10 DWPD drives built for heavy write workloads. Even then, this average is well below the rated DWPD.
Something important in the DWPD discussion is the SSD capacity. That is for two reasons. First, it is the denominator in our discussion. Second, the suitability of a drive for a workload often depends on capacity. If you are trying to create dense storage and displace hard drives, then having higher drive capacity is useful, but it also means workloads will be more read-focused. Conversely, if you just need a logging device, oftentimes a huge SSD would be silly to use. Here is what our capacity distribution looks like.
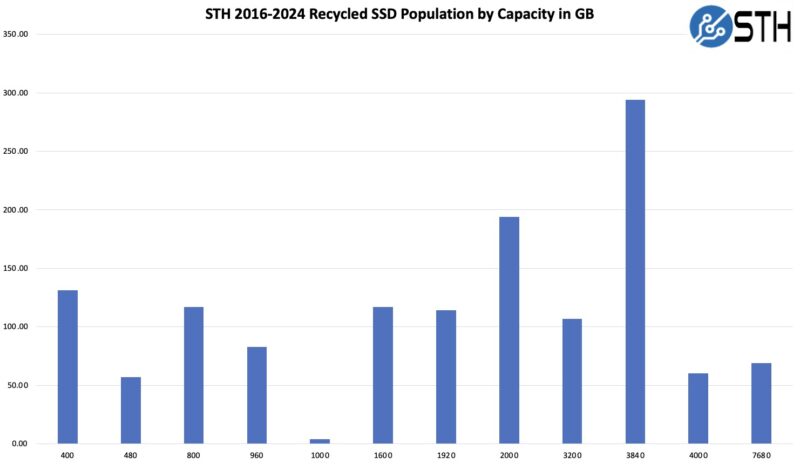
Recently, we have been using many more 3.84TB SSDs as that has been a sweet spot. Many vendors have been telling us that is popular these days as it provides enough capacity for many applications.
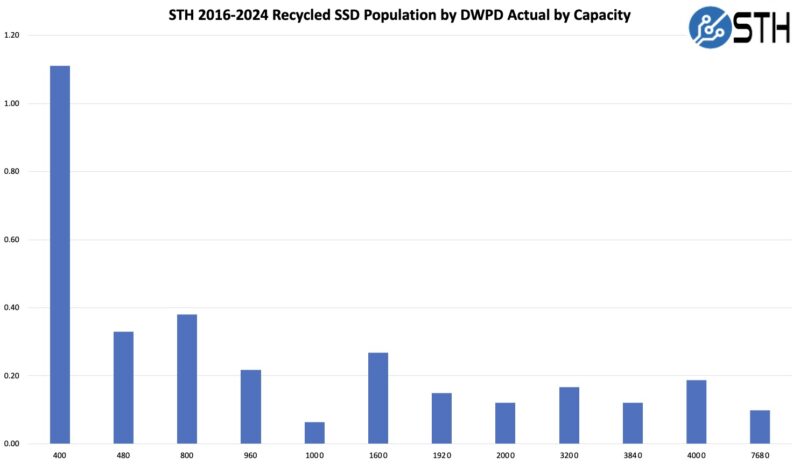
When we look at how much data was written to drives per day, we see a fairly clear trend based on the capacity. The smaller drives tended to see much higher drive writes per day than the larger drives. Also, the 1TB drives, which we did not have many of, were likely used as a boot drive or a similar application since they saw very little writes to the drives.
Averages are good, but we saw of the 400GB drives hit just shy of its rated endurance. The 800GB drive was a 10+ DWPD drive, so at under 3 DWPD, it was closer to a quarter of actual use versus its spec (again assuming these were all 4K random writes, which they were unlikely to be.)
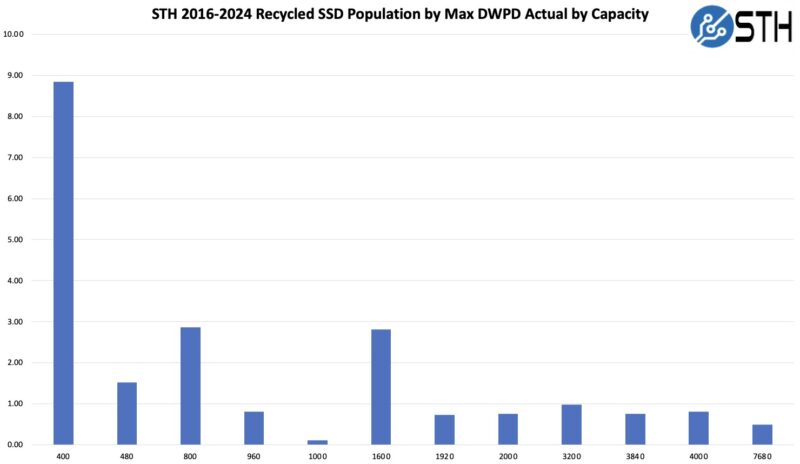
Looking at the other end, we see that getting to 1 DWPD on the larger drives was more of a worst case. Once files are stored on the drives to be read back over time, the need for high-endurance drives effectively goes away. The 3.84TB drives we purchased from multiple vendors and were our largest population capacity point, so that maximum of under 1 DWPD tells us a lot.
With that said, let us transition to our key lessons learned.


Any failures? What is the relation between unpowered data retention and DWPD.
This is why we’re all coming to STH!
I, perhaps stupidly, just format to 90% of capacity.. Let them burn up the write cycles, firmware can reallocate as needed.
Shrug.
I would note that the 3DWPD drives tend to have higher random R/W IOPS. This can be important when you get into heavy DBs or ERP systems.
We have bought about a dozen 3 TB Micron 9300 MAX drives with 3 DWPD in 2020. None of them failed, and it looks like when they hit 5 years they will have 50-70% endurance left, as per SMART data.
No plans to replace them at the end of the 5 yr warranty.
How does all this correlate to SSD endurance/DWPDs in single-user applications such as laptops or home desktop systems? My issue seems to stem from an apparent lacking of data for the home user and not enterprise server disk arrays. Also, WHAT ABOUT UNPOWERED DATA RETENTION?! Especially for portable SSDs that connect to a USB port and may not always get powered up every day the way server drives do? If I’m ever going to feel comfortable upgrading the “spinning rust” I currently have in my Bravo 17 to a large-capacity many-TBs SSD, I kinda need to know this!
@Stephen
Consumer SSDs are more reliable than consumer HDDs. In normal desktop usage you won’t come anywhere close to even hitting a 0.3DWPD usage. I’m still using my 240GB SATA SSD from 2013 and it hasn’t crashed.
In terms of unpowered data retention an SSD should be able to go a year without needing to be powered on to hold the data.
Going with an SSD over an HDD will make the biggest change to your overall user experience. It is very much worthwhile to go with one.
I made the switch to SSDs when affordable 4TB ones first came out. They were 2-3 times as expensive as magnetic disks, so I got 4TB magnetic ones as write mirrors. Since then the magnetic ones have failed at least once, but the original SSDs still work fine. So if you include the cost of replacing the magnetic disks, the SSDs were actually no more expensive overall, and this is 5-6 years ago. With SSD costs even lower now, the deal is even better.
Unfortunately I still have to buy magnetic disks because I don’t have enough drive bays to get the capacities I need in SSD form, which is why I’m so excited about these higher capacity SSDs coming out. Finally I might be able to go 100% SSD without sacrificing storage capacity.
@RJCvn: If you format a drive to 90% of its capacity, the remaining 10% will just sit unused, the drive will never use it to reallocate bad sectors to because drive firmware operates at a lower level than disk partitions. You need to overprovision the drive by using the manufacturer’s firmware utilities, which result in the drive reporting a smaller usable capacity. Then you format 100% of this smaller drive and the firmware will use the extra space for reallocating flaky flash cells.
But first you might want to look at the SMART data to see how much of this extra space is actually being used, since most manufacturers overprovision their drives already and you may find very little of this extra space is being used. With most drive firmwares doing wear levelling, it’s less likely for specific blocks to fail and more likely for the whole drive to start wearing out, as all the cells start failing at much the same time since the wear levelling means they’ve all been written to the same number of times.
Patrick, this is simply brilliant. Bravo!
Great analysis, thank you. I suspect I’ll be linking to this every time the ‘QLC write endurance’ discussion starts up again.
Relax, people – as long as you’re not chia plotting on the drive, it’ll probably be fine.
I can contribute one data point myself – I bought a used Kioxia CD6-R 7680GB from china early 2023. It arrived with about 9400 hours on it and 2,137,464 GB written. Yep, that’s over two Petabytes.
That makes for 278 drive writes in 392 days or about 0.7 DWPD on quite a big drive.
Hmm – actually, it’d top your max DWPD chart for the 7680GB capacity cathegory. Yay?
Either way, SMART tells me that it’s at 3% percentage used (attribute 05) – or 97% health remaining. Presumably sequential workloads, but yeah – good luck writing this drive to death. If it ever dies, I expect it’ll be the controller that goes.
Former server procurement guy here. I’d say endurance is still a factor, and we shouldn’t write it off so quickly. I definitely do agree it’s very often a factor of overestimated importance though. In my former job, I had a hard time convincing ops teams to monitor their actual DWPD (such an easy thing to do!) to show them they really don’t need these ~10 DWPD “write-intensive” (WI) SSDs that they insisted on spec’ing, and that they could easily do with ~3 DWPD “mixed-use” (MU) ones instead and stop over-buying.
And if we have to discuss about endurance, then DWPD, or actually DWPD-over-an-N-year-warranty-period (as it should be properly stated, but often isn’t…), is not that bad a metric actually. Expressing endurance as warranted TBW is another option (and one can easily translate one to the other), but the DWPD metric has the advantage of remaining comparable across capacity classes, and to allow useful classification such as the industry standard “write-intensive” (WI, ~10 DWPD) or “mixed-use” (MU, ~3 DWPD).
Also, something that people persistly can’t seem to understand is that, within a given SSD product line, a 3.84 TB MU SSD and a 3.2 TB WI SSD are hardware-wise the exact same 4 TiB = 4.4 TB SSD, just with different firmware parameters that set aside more (WI) or less (MU) spare NAND cells.
And because yes, we tend to overestimate our actual DPWD needs, a fair part of these spare cells end up to be unused. This is wasted capacity, it comes with a cost, and this is something worth working on, at the very least by collecting usage data in the telemetry, for people to get a better grasp of what they actually use and need.
I know that (at least some…) hyperscalers go even further and purchase SSDs with special firmware that allows them (among other things) to manage cell wear-levelling their own way and optimize it to their specific workloads, thus reducing this waste and the associated cost to basically nothing.
@G
I have some 7.68TB Micron 9300 Pro 1DWPD NVMe drives in a Software Defined Storage Array. We got them in 2019 and after 5 years of use that includes development DBs they are at 4% used according to SMART. We also have a VMware vSAN array using P4800X as the cache drive and WD Gold (rebranded Ultrastar DC SN640s) as the capacity drives. After 4 years of use with even more DBs in that cluster they show 0% used in SMART. You are 100% correct that people overestimate how much will be written to the drives. Unless you have a storage network that can handle the extra IOPS by the MU drives 99.999% of the time the RI (1DWPD) drives will last longer than the SAN. Heck I have 2 240GB Intel D3-S4510s acting as a write cache for a NAS. Those are 2DWPD disks that I set to a higher over-provisioning. After 4 years of HEAVY writes they still have 35% life left.
These drives should have been destroyed. The fact that you were able to acquire them is mortifying.
Why should they be destroyed? Encryption is a thing. We believe in math.
I would love to see the other stats on these devices, the wearout indicators, time over critical temp, etc.
I think there’s like a specific subset of apps and uses that need 30DWPD or more. For everything else, you’re right that they’re better with bigger drives.
You made this point in the video, but not in the article, but we saw exactly what you said there. 24 disk RAID 16TB array in HDD took over a week to complete rebuilding a failed drive due to the activity. We just lost one with Micron 15.36TB SSDs and the 24 drive array took less than a day to be fully rebuilt. That’s worth a lot too.
Is this dataset available? I’d be more interested in seeing total writes (sliced along similar dimensions) rather than daily writes.
Patrick, you’re claiming sequential writes are less problematic than random 4K writes. How is this possible, since all sequential writes are sequentially written blocks?
I know the internal block size of an SSD might be bigger than 4K. But all what I have seen is that SMART reports the blocksize in its metric then, too. Is there any cornercase I’m overlooking.
If you write 4K random it makes drives write to cells not full, so you’re eating PE cycles without writing the cell out fully with data. If you write sequential big blocks you’re using most if not all of a cell’s data.
Just to add, I had a few 1.6TB Intel S3500 drives (pretty old SATA stuff) that were rated at 880TBW at that capacity and they regularly died just after 4PBW, outperforming their rated writes nearly five times.
Of course, this isn’t recommended in the slightest, but it shows that sometimes even the manufacturers can underestimate what their drives are capable of.
@David,
I would suggest you go F yourself with that kind of attitude toward used drives, but if you’re that anally-retentive, you wouldn’t be able to.
Great data. I always had a feeling that recycled drives, like DRAM, should be a bigger market than it currently is.