
Today, we are showing the results from a massive project that we have been running since 2013. In the 2013-2016 timeframe, we inadvertently started creating a dataset that gave a unique insight into the actual write workloads to drives. In 2016 we published our Used enterprise SSDs: Dissecting our production SSD population piece. Out of necessity, we were purchasing used SSDs to fill slots in servers. Those SSDs contained data about how the previous owners utilized the drives and therefore, gave us a unique insight into required endurance. Today, we are updating that 2016 piece with a broader range of capacities and several times more drives to get an updated look on SSD endurance needs.
The DWPD Background
In the storage industry, we are still burdened by a metric that was developed well over a decade ago. The “Drive Write Per Day” or DWPD metric was born in the era of tiny solid-state drives (SSDs) in the sub 100GB capacity range. With today’s drives that can reach capacities 1000x that of when the DWPD metric was highly scrutinized, the entire industry has changed, and the metric needs to give way.
As a quick note, you will see many Solidigm SSDs here. It was a discussion with the company that led to us refreshing this study and we are going to say this is sponsored. At the same time, we buy SSDs from many vendors and the data has been collected for around a decade so well before Solidigm was a company.
The metric itself was really interesting and is rooted in the physical properties of the NAND flash chips that are used in almost every SSD. We are not going into the details on how data is written to NAND cells, but the high level is that NAND actually can wear out over time. NAND is rated for program/ erase (P/E) cycles, which you can think of as writing in pencil on a piece of paper. After data is written in pencil on the paper, it can be erased using an eraser, and then written over. At some point, however, the paper wears out. NAND eventually can wear out and no longer reliably store new data.
Especially as NAND started increasing the number of bits stored per cell, folks started to get concerned with how those technology transitions also led to fewer P/E cycles for the NAND and, therefore, lowered endurance. The industry created the DWPD metric to communicate how many times a drive can be completely written each day during a warrantied period (usually five years.) The standard for DWPD ratings is using 4K random writes, which are basically a worst-case style workload.
If you have an 80GB SSD, it is fairly trivial to generate enough data to fill the drive. The video accompanying this piece is one of the smaller 4K project files we have, but it is still well over 100GB. While we might write one project folder worth of data to a drive, it would seem unlikely that we would write that folder, delete it, and then write it nine more times each day for 5 years straight in a 10 DWPD duty cycle. If that sounds unlikely, it goes a step further as writing photos and videos is a more sequential workload that can be written more efficiently to NAND and, therefore, does not burn through P/E cycle limits like the 4K random write workloads that drive are usually rated for. This is extremely important to our discussion later.
Still, the challenge is planning for SSD endurance needs when most organizations have very little understanding of how much data is being written to each drive, and the types of workloads they run. As a result, finding a way to show this is much harder than one would expect. A company may have a few workloads that dominate storage patterns, which may also differ from other organizations. When a single organization publishes its data, it can show results from many drives but often is representative of its own workloads and usage patterns.
Another challenge is that as drives increase in capacity, the type of data changes. While a smaller 100GB drive may be used primarily as a write cache or logging drive, a larger drive at, say, 61.44TB is often displacing hard drives for storing large data sets such as video files. As drives get bigger, the proportion of reads to writes often increases and the write patterns become more sequential. A study looking at 400GB drives is thus less useful when drives hit 4TB, 40TB, or even more in capacity. As drives get larger, DWPD based on 100% 4K random writes becomes even less relevant.
That brings us to a fun methodology for collecting data on how drives are actually used.
Collecting DWPD Data and the Population
Since we often need to fill drive slots in servers, we are constantly on the hunt for low-cost sources of SSDs. Over the years, we often buy small numbers of used data center SSDs from various sources including eBay, our forums, recyclers, and so forth. These drives are often purchased 1-4 drives at a time. We also buy several small batches of new drives that are often extras from data centers. For our purposes today, the used SSDs are more exciting.
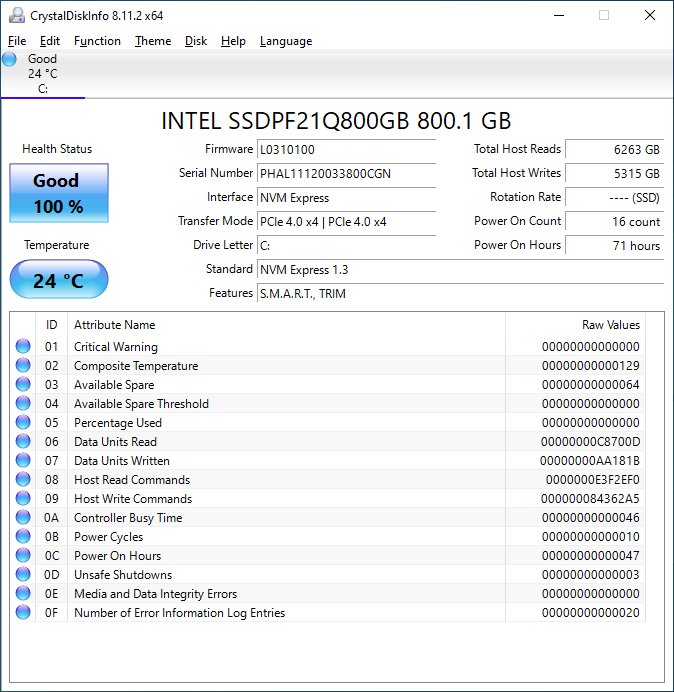
SSDs record how much data has been written to the drive, as well as the number of Power On Hours. That means that we have an amount of data written to the drive over a time period. From there, we can simply see how much data is written per day on average to get an actual DWPD figure. We will note that we have quite a few Intel Optane drives. Those have 10 DWPD to 100 DWPD ratings, and so they skewed the data so much that we pulled them out of our dataset as well.
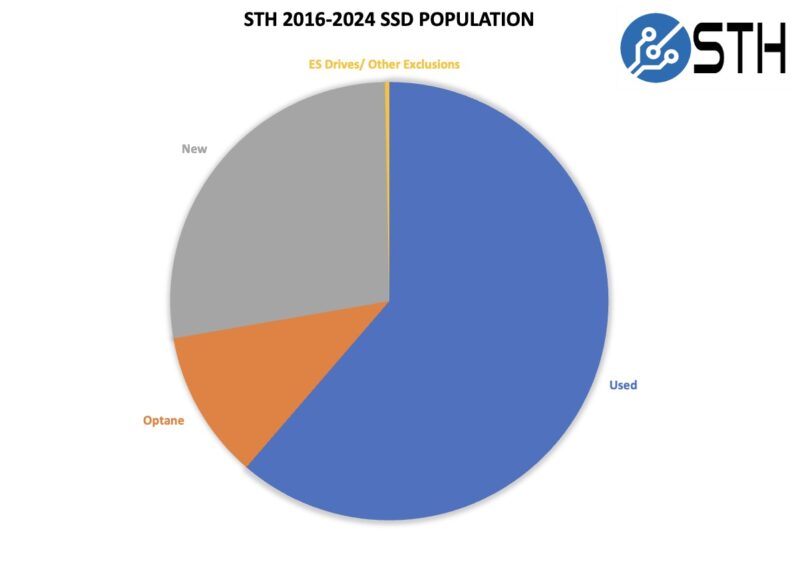
With all of this, we whittled our total population down to 1347 NAND SSDs where we recorded the power on hours and the amount of data written when we received the used SSD.
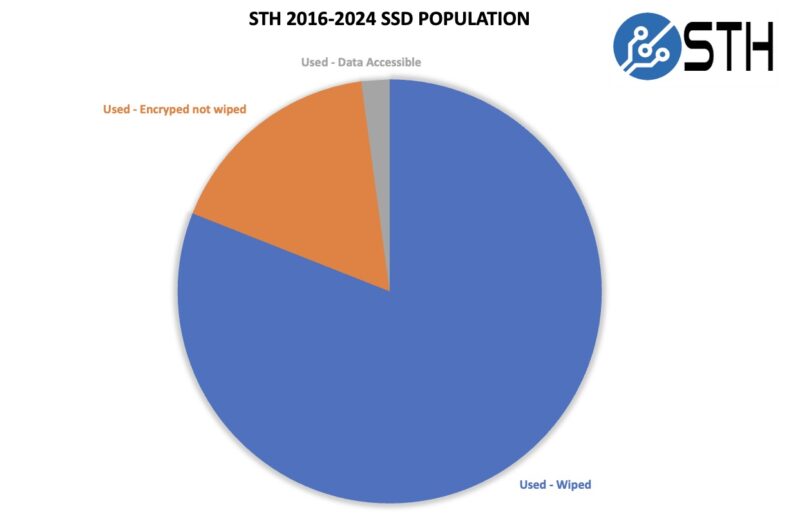
We also record the number of drives that have data accessible, which has gone down significantly since our 2016 version.
These 1347 drives have been purchased over about eight years and in small batches. As such, they are coming from different sources and were used by different organizations before we took readings from them. While not perfect, it helps ensure we see more than one organization’s workload on the drives.
With that, let us get to what we learned from the population.


Any failures? What is the relation between unpowered data retention and DWPD.
This is why we’re all coming to STH!
I, perhaps stupidly, just format to 90% of capacity.. Let them burn up the write cycles, firmware can reallocate as needed.
Shrug.
I would note that the 3DWPD drives tend to have higher random R/W IOPS. This can be important when you get into heavy DBs or ERP systems.
We have bought about a dozen 3 TB Micron 9300 MAX drives with 3 DWPD in 2020. None of them failed, and it looks like when they hit 5 years they will have 50-70% endurance left, as per SMART data.
No plans to replace them at the end of the 5 yr warranty.
How does all this correlate to SSD endurance/DWPDs in single-user applications such as laptops or home desktop systems? My issue seems to stem from an apparent lacking of data for the home user and not enterprise server disk arrays. Also, WHAT ABOUT UNPOWERED DATA RETENTION?! Especially for portable SSDs that connect to a USB port and may not always get powered up every day the way server drives do? If I’m ever going to feel comfortable upgrading the “spinning rust” I currently have in my Bravo 17 to a large-capacity many-TBs SSD, I kinda need to know this!
@Stephen
Consumer SSDs are more reliable than consumer HDDs. In normal desktop usage you won’t come anywhere close to even hitting a 0.3DWPD usage. I’m still using my 240GB SATA SSD from 2013 and it hasn’t crashed.
In terms of unpowered data retention an SSD should be able to go a year without needing to be powered on to hold the data.
Going with an SSD over an HDD will make the biggest change to your overall user experience. It is very much worthwhile to go with one.
I made the switch to SSDs when affordable 4TB ones first came out. They were 2-3 times as expensive as magnetic disks, so I got 4TB magnetic ones as write mirrors. Since then the magnetic ones have failed at least once, but the original SSDs still work fine. So if you include the cost of replacing the magnetic disks, the SSDs were actually no more expensive overall, and this is 5-6 years ago. With SSD costs even lower now, the deal is even better.
Unfortunately I still have to buy magnetic disks because I don’t have enough drive bays to get the capacities I need in SSD form, which is why I’m so excited about these higher capacity SSDs coming out. Finally I might be able to go 100% SSD without sacrificing storage capacity.
@RJCvn: If you format a drive to 90% of its capacity, the remaining 10% will just sit unused, the drive will never use it to reallocate bad sectors to because drive firmware operates at a lower level than disk partitions. You need to overprovision the drive by using the manufacturer’s firmware utilities, which result in the drive reporting a smaller usable capacity. Then you format 100% of this smaller drive and the firmware will use the extra space for reallocating flaky flash cells.
But first you might want to look at the SMART data to see how much of this extra space is actually being used, since most manufacturers overprovision their drives already and you may find very little of this extra space is being used. With most drive firmwares doing wear levelling, it’s less likely for specific blocks to fail and more likely for the whole drive to start wearing out, as all the cells start failing at much the same time since the wear levelling means they’ve all been written to the same number of times.
Patrick, this is simply brilliant. Bravo!
Great analysis, thank you. I suspect I’ll be linking to this every time the ‘QLC write endurance’ discussion starts up again.
Relax, people – as long as you’re not chia plotting on the drive, it’ll probably be fine.
I can contribute one data point myself – I bought a used Kioxia CD6-R 7680GB from china early 2023. It arrived with about 9400 hours on it and 2,137,464 GB written. Yep, that’s over two Petabytes.
That makes for 278 drive writes in 392 days or about 0.7 DWPD on quite a big drive.
Hmm – actually, it’d top your max DWPD chart for the 7680GB capacity cathegory. Yay?
Either way, SMART tells me that it’s at 3% percentage used (attribute 05) – or 97% health remaining. Presumably sequential workloads, but yeah – good luck writing this drive to death. If it ever dies, I expect it’ll be the controller that goes.
Former server procurement guy here. I’d say endurance is still a factor, and we shouldn’t write it off so quickly. I definitely do agree it’s very often a factor of overestimated importance though. In my former job, I had a hard time convincing ops teams to monitor their actual DWPD (such an easy thing to do!) to show them they really don’t need these ~10 DWPD “write-intensive” (WI) SSDs that they insisted on spec’ing, and that they could easily do with ~3 DWPD “mixed-use” (MU) ones instead and stop over-buying.
And if we have to discuss about endurance, then DWPD, or actually DWPD-over-an-N-year-warranty-period (as it should be properly stated, but often isn’t…), is not that bad a metric actually. Expressing endurance as warranted TBW is another option (and one can easily translate one to the other), but the DWPD metric has the advantage of remaining comparable across capacity classes, and to allow useful classification such as the industry standard “write-intensive” (WI, ~10 DWPD) or “mixed-use” (MU, ~3 DWPD).
Also, something that people persistly can’t seem to understand is that, within a given SSD product line, a 3.84 TB MU SSD and a 3.2 TB WI SSD are hardware-wise the exact same 4 TiB = 4.4 TB SSD, just with different firmware parameters that set aside more (WI) or less (MU) spare NAND cells.
And because yes, we tend to overestimate our actual DPWD needs, a fair part of these spare cells end up to be unused. This is wasted capacity, it comes with a cost, and this is something worth working on, at the very least by collecting usage data in the telemetry, for people to get a better grasp of what they actually use and need.
I know that (at least some…) hyperscalers go even further and purchase SSDs with special firmware that allows them (among other things) to manage cell wear-levelling their own way and optimize it to their specific workloads, thus reducing this waste and the associated cost to basically nothing.
@G
I have some 7.68TB Micron 9300 Pro 1DWPD NVMe drives in a Software Defined Storage Array. We got them in 2019 and after 5 years of use that includes development DBs they are at 4% used according to SMART. We also have a VMware vSAN array using P4800X as the cache drive and WD Gold (rebranded Ultrastar DC SN640s) as the capacity drives. After 4 years of use with even more DBs in that cluster they show 0% used in SMART. You are 100% correct that people overestimate how much will be written to the drives. Unless you have a storage network that can handle the extra IOPS by the MU drives 99.999% of the time the RI (1DWPD) drives will last longer than the SAN. Heck I have 2 240GB Intel D3-S4510s acting as a write cache for a NAS. Those are 2DWPD disks that I set to a higher over-provisioning. After 4 years of HEAVY writes they still have 35% life left.
These drives should have been destroyed. The fact that you were able to acquire them is mortifying.
Why should they be destroyed? Encryption is a thing. We believe in math.
I would love to see the other stats on these devices, the wearout indicators, time over critical temp, etc.
I think there’s like a specific subset of apps and uses that need 30DWPD or more. For everything else, you’re right that they’re better with bigger drives.
You made this point in the video, but not in the article, but we saw exactly what you said there. 24 disk RAID 16TB array in HDD took over a week to complete rebuilding a failed drive due to the activity. We just lost one with Micron 15.36TB SSDs and the 24 drive array took less than a day to be fully rebuilt. That’s worth a lot too.
Is this dataset available? I’d be more interested in seeing total writes (sliced along similar dimensions) rather than daily writes.
Patrick, you’re claiming sequential writes are less problematic than random 4K writes. How is this possible, since all sequential writes are sequentially written blocks?
I know the internal block size of an SSD might be bigger than 4K. But all what I have seen is that SMART reports the blocksize in its metric then, too. Is there any cornercase I’m overlooking.
If you write 4K random it makes drives write to cells not full, so you’re eating PE cycles without writing the cell out fully with data. If you write sequential big blocks you’re using most if not all of a cell’s data.
Just to add, I had a few 1.6TB Intel S3500 drives (pretty old SATA stuff) that were rated at 880TBW at that capacity and they regularly died just after 4PBW, outperforming their rated writes nearly five times.
Of course, this isn’t recommended in the slightest, but it shows that sometimes even the manufacturers can underestimate what their drives are capable of.
@David,
I would suggest you go F yourself with that kind of attitude toward used drives, but if you’re that anally-retentive, you wouldn’t be able to.
Great data. I always had a feeling that recycled drives, like DRAM, should be a bigger market than it currently is.