WD SN850X 1TB Performance Testing
We test using both the default smaller test size as well as larger test sets on our benchmarks. This allows us to see the difference between lighter and heavier workloads.
CrystalDiskMark x64
CrystalDiskMark is used as a basic starting point for benchmarks as it is something commonly run by end-users as a sanity check.
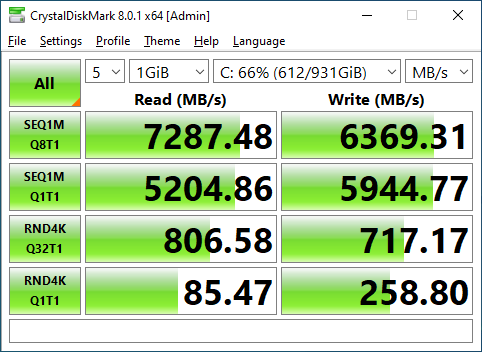
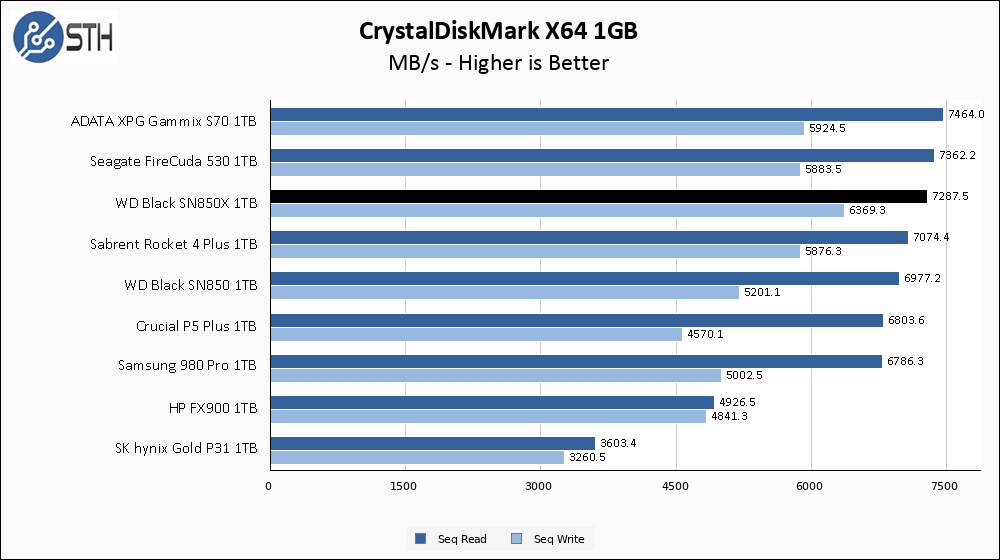
The WD SN850X 1TB fares well in CrystalDiskMark. It turns in sequential read and write performance that is right at the advertised levels, and the write speed is fast enough to represent the top result for a 1TB drive in my entire benchmark database.
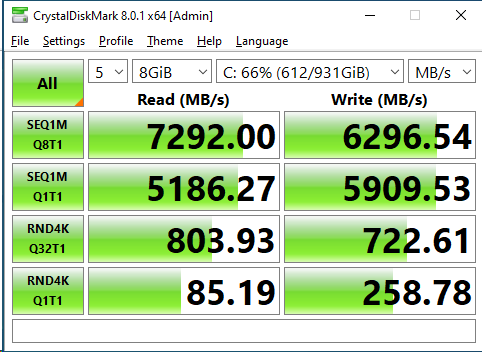
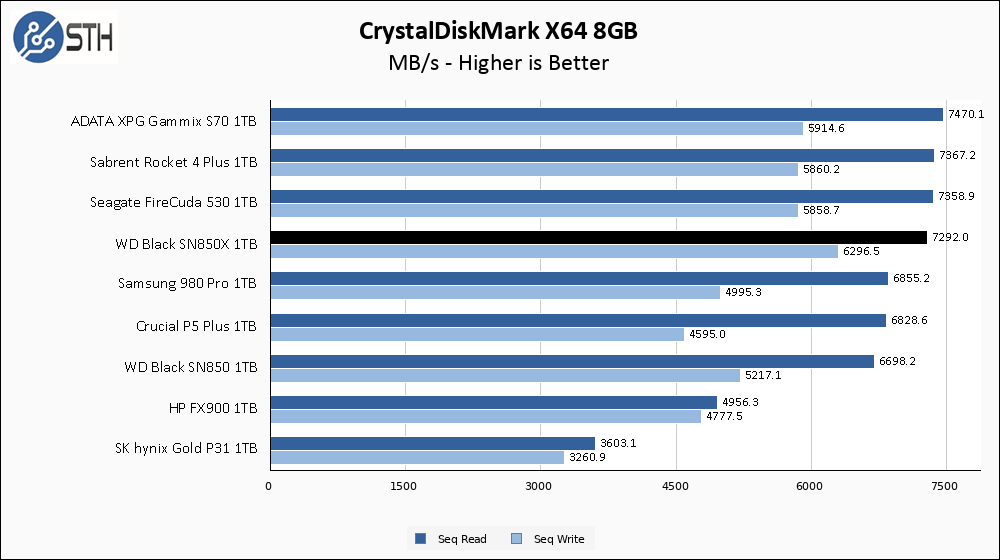
Just as I like to see, the move to the larger CrystalDiskMark test has a negligible effect on the SN850X. Once again, the sequential write speed on this drive is the top result for any 1TB drive I have tested.
ATTO Disk Benchmark
The ATTO Disk Benchmark has been a staple of drive sequential performance testing for years. ATTO was tested at both 256MB and 8GB file sizes.
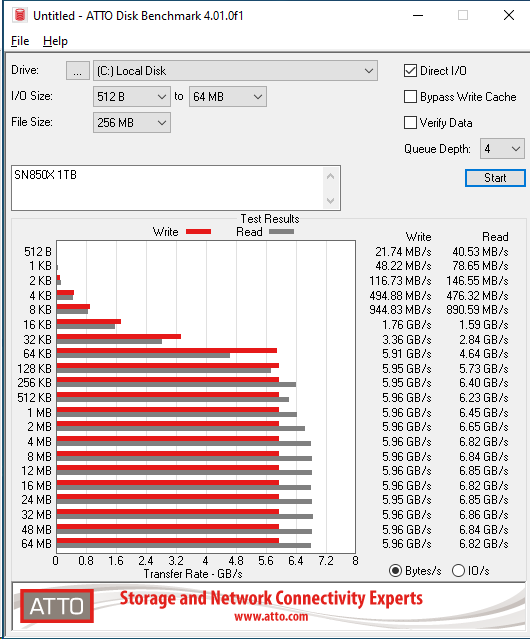
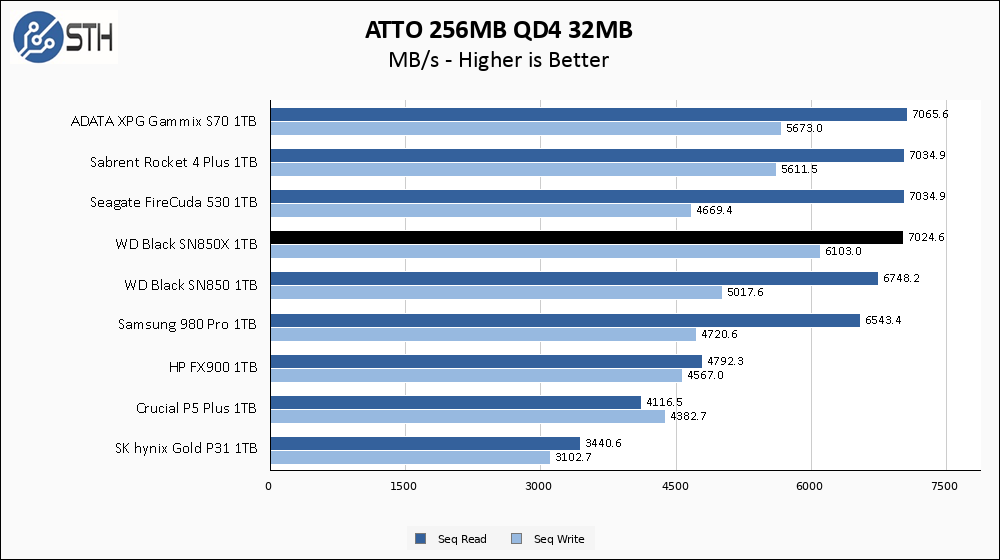
The SN850X does almost as well in ATTO as it does in CrystalDiskMark. I forgot to include it on this graph, but the SN850X does not quite take the write speed crown in ATTO; that honor belongs to the SK hynix Platinum P41. Still though, a dead heat for first place in read speed and second place for writes is a fine result.
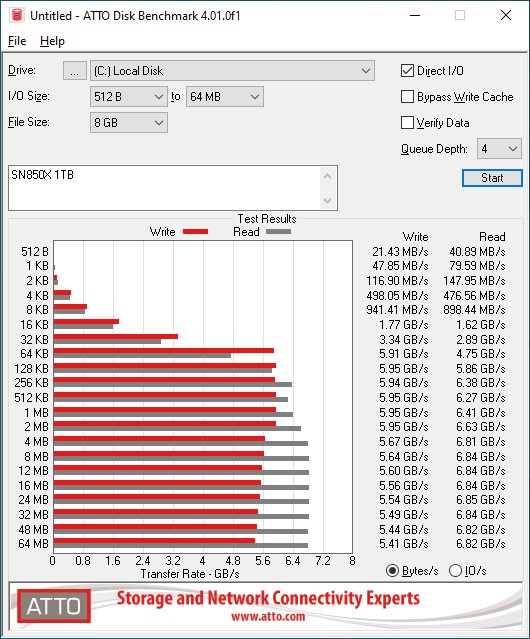
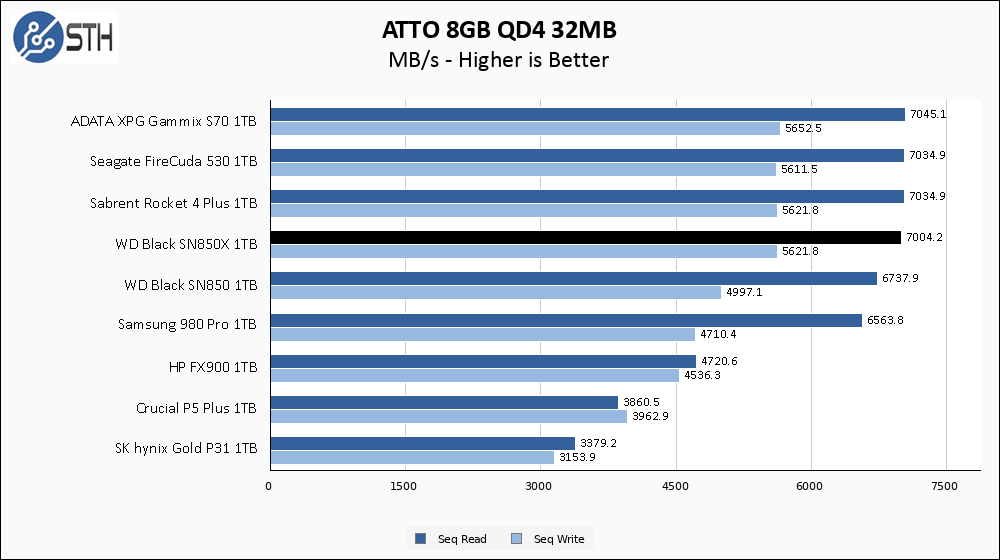
On the larger ATTO test, the SN850X continues to perform well, but its write speed falls more in line with my other high-end drives. The P41 (not included in the graph) maintains its ATTO write speed dominance here as the only 1TB drive to separate itself from the pack.
Anvil’s Storage Utilities
Anvil’s Storage Utilities is a comprehensive benchmark that gives us a very in-depth look at the performance of the drives tested. This benchmark was run with both a 1GB and 8GB test size.
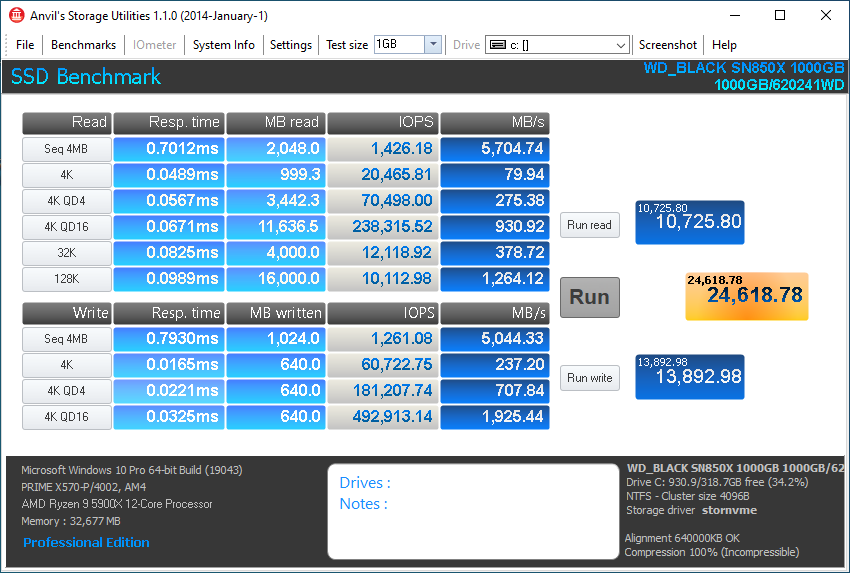
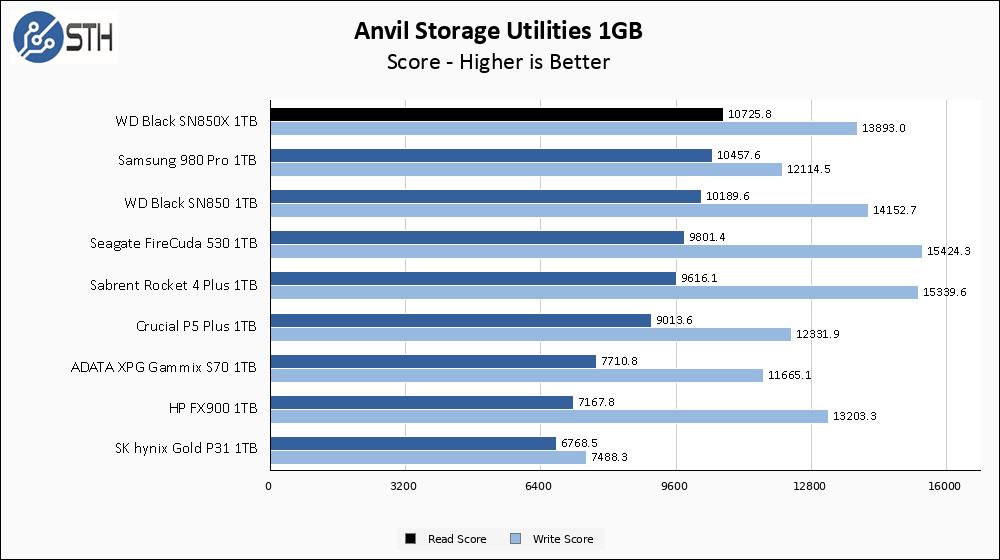
In Anvil, the WD SN850X 1TB changes the script a bit and turns in the highest read score I have seen yet from a 1TB drive. The write score is also good, but not chart-topping like the read score.
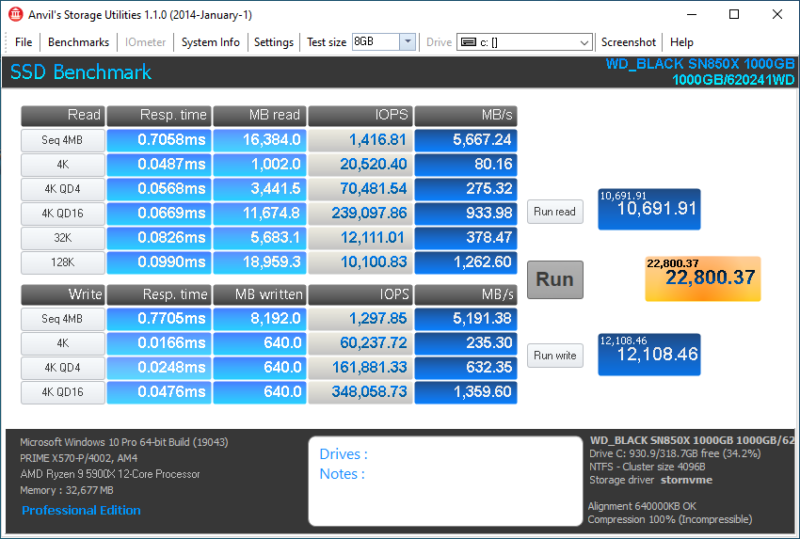
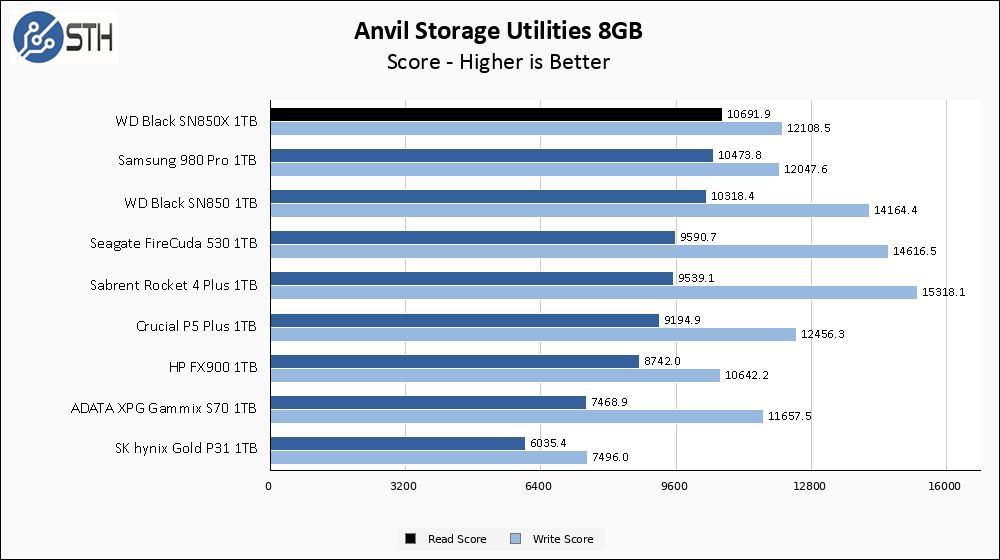
The good results for the SN850X continue in the larger Anvil test. Once again, the SN850X turns in the best read score result I have seen from a 1TB drive while remaining decently competitive in write score.
AS SSD Benchmark
AS SSD Benchmark is another good benchmark for testing SSDs. We run all three tests for our series. Like other utilities, it was run with both the default 1GB as well as a larger 10GB test set.
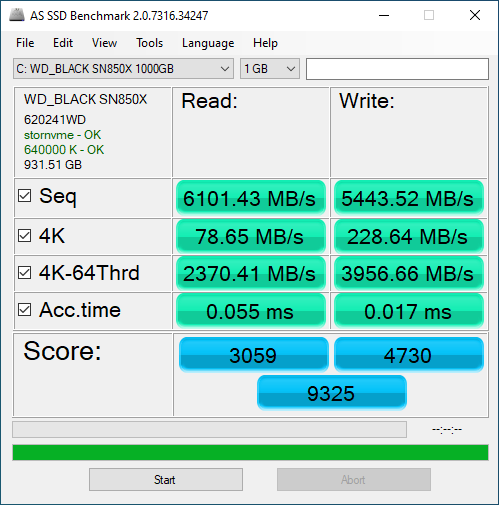
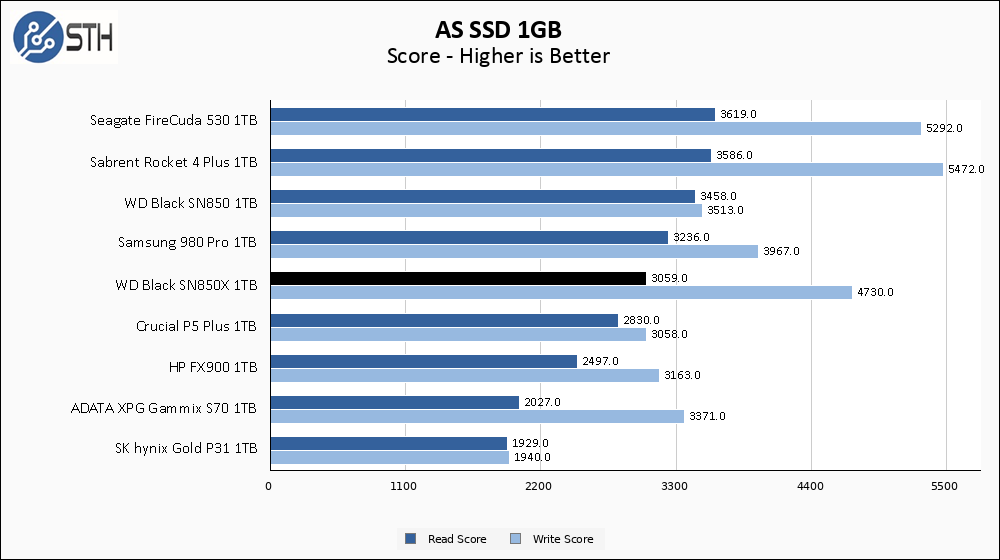
If any benchmark I have run is the SN850X’s weak spot, it would be AS SSD. While the write score is excellent, the read score is much more middle-of-the-pack and manages to be beaten by its own predecessor in the SN850. The results here are still pretty good, just not reaching for the stars like on previous tests.
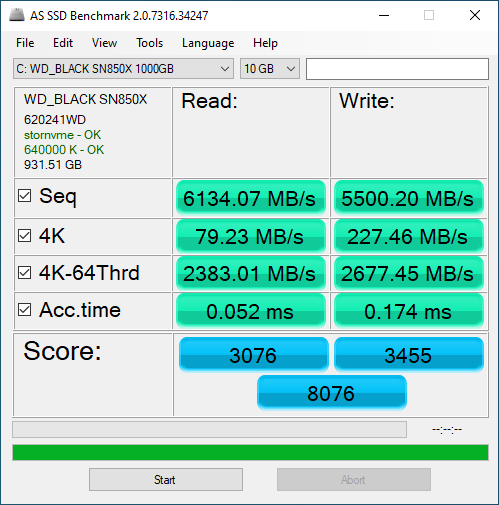
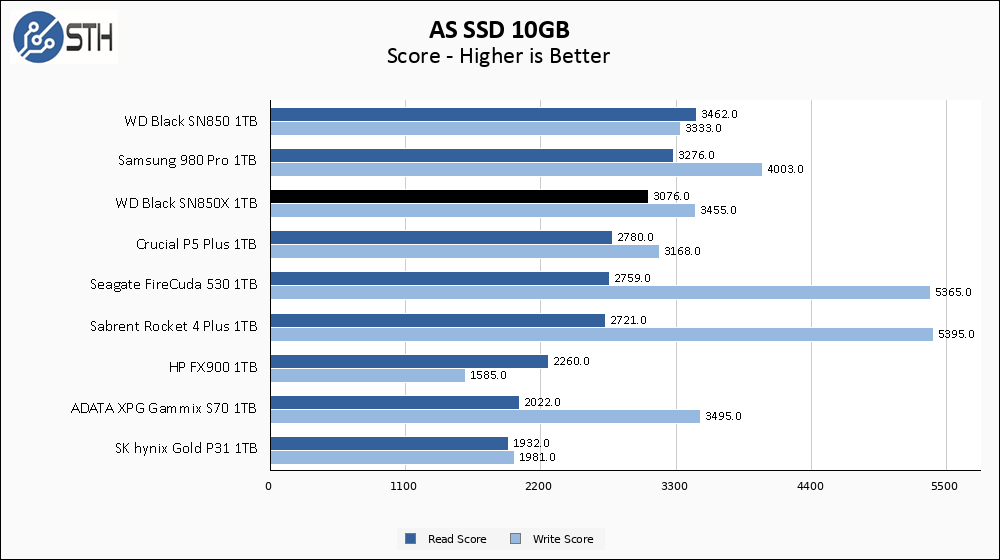
The larger AS SSD test is a bit of a mixed bag for the SN850X. While the gap in read score closes a bit, allowing the SN850X to move up a slot on the chart, the write score also shrinks for the SN850X. As a result, its once commanding write score lead over the previous SN850 is reduced to a much smaller margin of victory, and the SN850 is top of the chart for read score.
SPECworkstation, thermals, and our conclusion are up next.


The factor two difference in sustained write between this and SSDs with otherwise similar performance makes me think more attention should be given to this metric.
Compared to cache sizes that have been tuned to popular benchmarking tools, sustained write performance might be a more meaningful number, especially if one is rebuilding a ZFS storage pool, mirror RAID or even BTRFS.
With heatsinks less expensive then without… Feels like being scammed….
I bought one of these, and I find that simply does not work under linux (at least on my X570 motherboard with Ryzen 5950X) due to power/sleep state issues. I’ve replaced it with a Rocket 4 Plus, and I’m still hoping to repurpose the SN850X elsewhere…
One nice thing about this series of drives is unlike the Samsung 9×0 Plain/Evo/Pro consumer line of SSDs the WD Black line can be reformatted with 4K LBA instead of 512. In certain applications this has dramatic benefits. I note that neither latency nor CPU usage appears in the review, and those are two things you would expect to improve with a larger logical block.
For example, my WD vs. Samsung SSD in the same system, QD=1 single-threaded random reads, I get 89% more IOPS on the WD, with one third the latency (11µs vs. 30µs at the median) with only 31% more CPU used (that is, 24% *less* CPU per IO).
On the other hand the WD runs out of gas earlier. The Samsung with more internal parallelism can hit 800k IOPS with 8 threads and QD=8, while the WD runs out of juice at 450k IOPS at 8 threads regardless of queue depth. So there are tradeoffs in both these controller architectures.
The SN850X saved 1 degree and lost 25% of the sustained performance compared to the older SN850. It makes no difference for daily usage, but when cloning drives frequently, wasting 25% more time is out of the question.
Thank you Will for including all the latest 1TB drives in your review. I had to check older reviews to see the temperature of the rest of the drives. Hope you’ll include all of them in future reviews.
What is the advantage of leaving the back side of the PCB blank? Is it just for cost savings (not having to use 2 extra flash chips) or is there another reason?