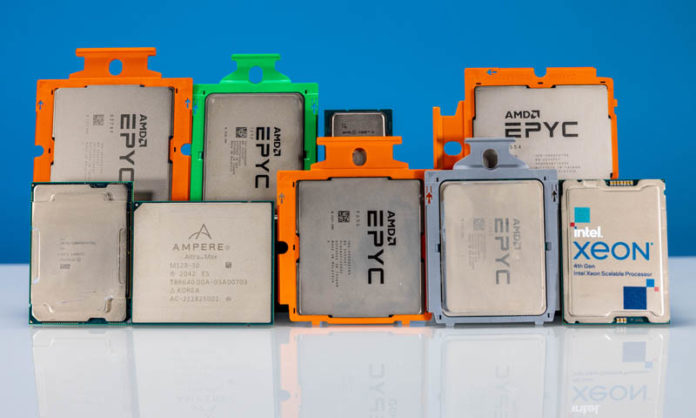
Now that we are through the latest Intel Xeon and AMD EPYC launches, we can update our core count by year charts. We started doing these charts a few years ago but started doing the new format recently. As such, we wanted to update our view.
Updated AMD EPYC and Intel Xeon Core Counts Over Time
Here is the updated core count growth by year chart from 2010 to 2023. We are starting this chart with the Westmere-EP and AMD Socket G34 and then moving on to the newer CPUs. We are adding the AMD EPYC “Bergamo” to this chart since that is expected in 2023, but that is the SKU that is not launched yet.
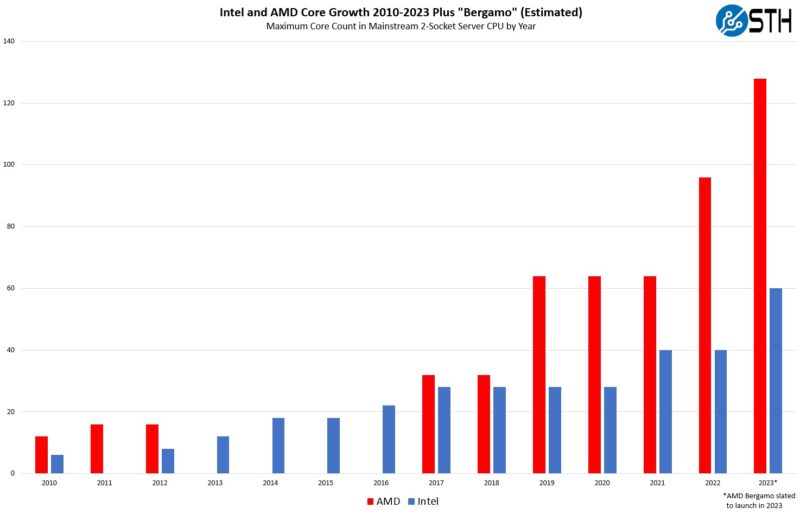
Something that is very clear looking at this is that Intel has started increasing core counts significantly again. From 2017’s 1st Gen Intel Xeon Scalable “Skylake” launch through Cascade Lake/ Cooper Lake, and until the Ice Lake Xeon era in 2021 28 cores was the maximum for Intel and growth was stagnant. In the last just over two years, Intel has doubled core counts from Cascade/ Cooper to the latest 4th Gen Intel Xeon Scalable Sapphire Rapids. For AMD’s part, there was a similar story from 2019’s AMD EPYC “Rome” launch through “Milan.” With Genoa in late 2022, core counts jumped by 50%. In 2023, we expect to see a 2x increase in core counts over 2021’s “Milan” generation with Genoa.
Core counts are important, but they are far from the only metric. At the same time, we have seen both clock speeds as well as memory bandwidth, and IPC increase. A 2022-era AMD EPYC 9004 Genoa core is very different from a Xeon E5 core.
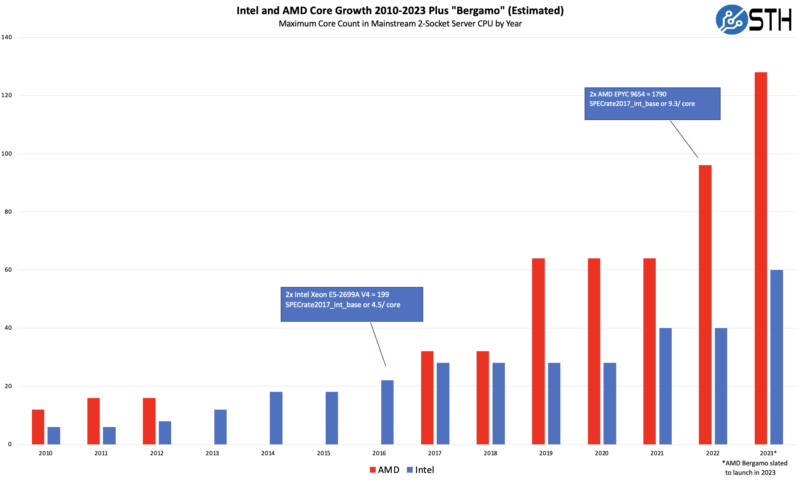
The 2016-2017 era Intel Xeon E5-2600 V4 high core count parts are only about half as fast as a 2022 era AMD EPYC Genoa. While core counts are up about 4.4x since AMD re-entered the market (Broadwell-EP to Genoa), higher clocks and IPC have led to roughly a doubling in SPEC CPU2017 integer performance.
Final Words
More cores, and more performance per core, have really changed the market. Many 2017-era servers were using the Intel Xeon E5-2600 V4 series, and most were not a 22-core processor. That is an amazing replacement cycle per socket performance increase of roughly 9x while also increasing cores by a significant amount.
This is not the most important statistic, but we just wanted to put the charts out there so folks could visualize per socket core growth.


Nice CPU collection for the cover photo. I’ll take one of each, thank you. :-)
I love how AMD’s attitude was basically “f*** it, we’re taking this cycle off” from 2012 to 2017…
@Matt H.
AMD had a branch mispredict in uArch design with Bulldozer, and when you are designing processors that is indeed the typical latency for a pipeline flush…3-5 years.
So a core is a core is a core. And next year, when Sierra Forest comes out, will you update this chart with its core count?
That is the plan JayN. A Bergamo core is more like a Milan core in terms of perf with Genoa arch but with less cache. I think what you are hinting at is that Sierra is on a different perf/ core range, more like an Ampere Altra is today. Valid. We will cross that bridge when we get there.