Tyan Thunder SX GT90-B7113 Performance
At STH, we have an extensive set of performance data from every major server CPU release. Running through our standard test suite generated over 1000 data points for each set of CPUs. We are cherry-picking a few to give some sense of CPU scaling.
Python Linux 4.4.2 Kernel Compile Benchmark
This is one of the most requested benchmarks for STH over the past few years. The task was simple, we have a standard configuration file, the Linux 4.4.2 kernel from kernel.org, and make the standard auto-generated configuration utilizing every thread in the system. We are expressing results in terms of compiles per hour to make the results easier to read.
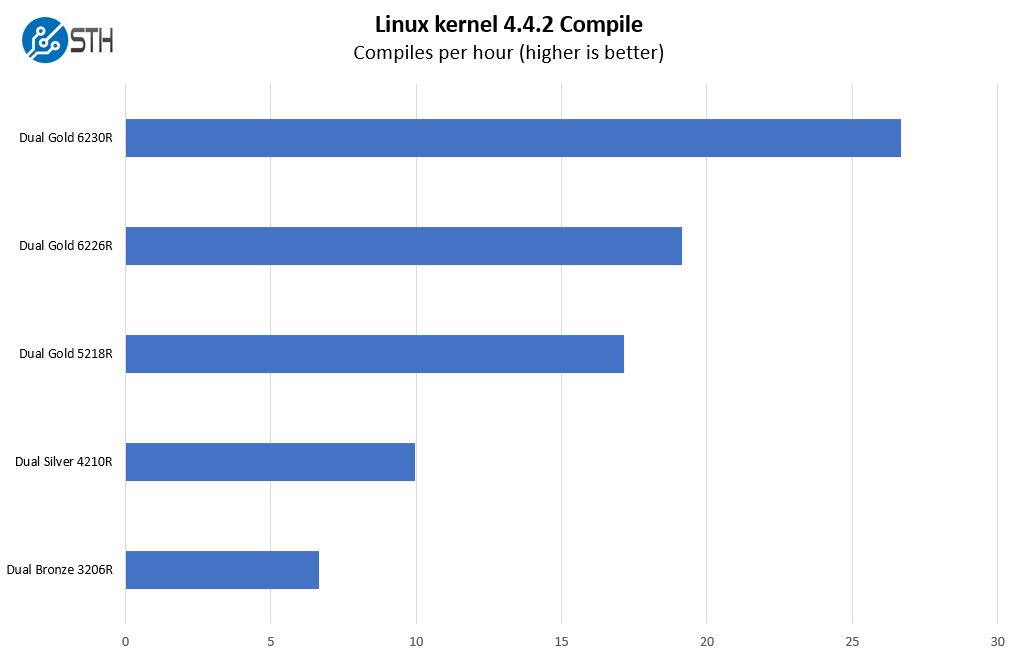
Here we see a fairly good range of performance even in this TDP envelope that we have for the Thunder SX server.
c-ray 1.1 Performance
We have been using c-ray for our performance testing for years now. It is a ray tracing benchmark that is extremely popular to show differences in processors under multi-threaded workloads. We are going to use our new Linux-Bench2 8K render to show differences.
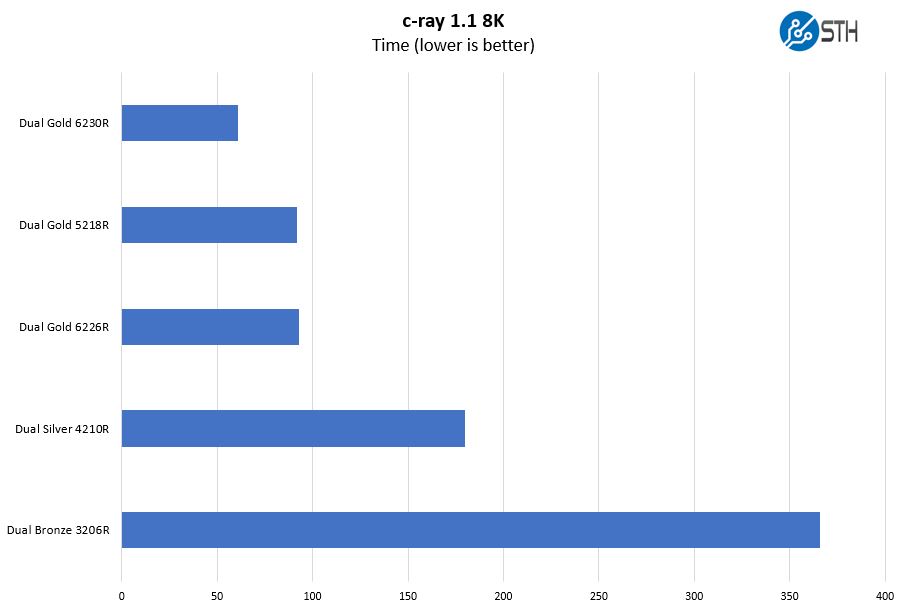
For scale-out storage, we sometimes see dual Xeon Bronze 3206R SKUs used. We generally tell our readers that for a low incremental cost the Xeon Silver line is a better value. This is a good example of why.
7-zip Compression Performance
7-zip is a widely used compression/ decompression program that works cross-platform. We started using the program during our early days with Windows testing. It is now part of Linux-Bench.
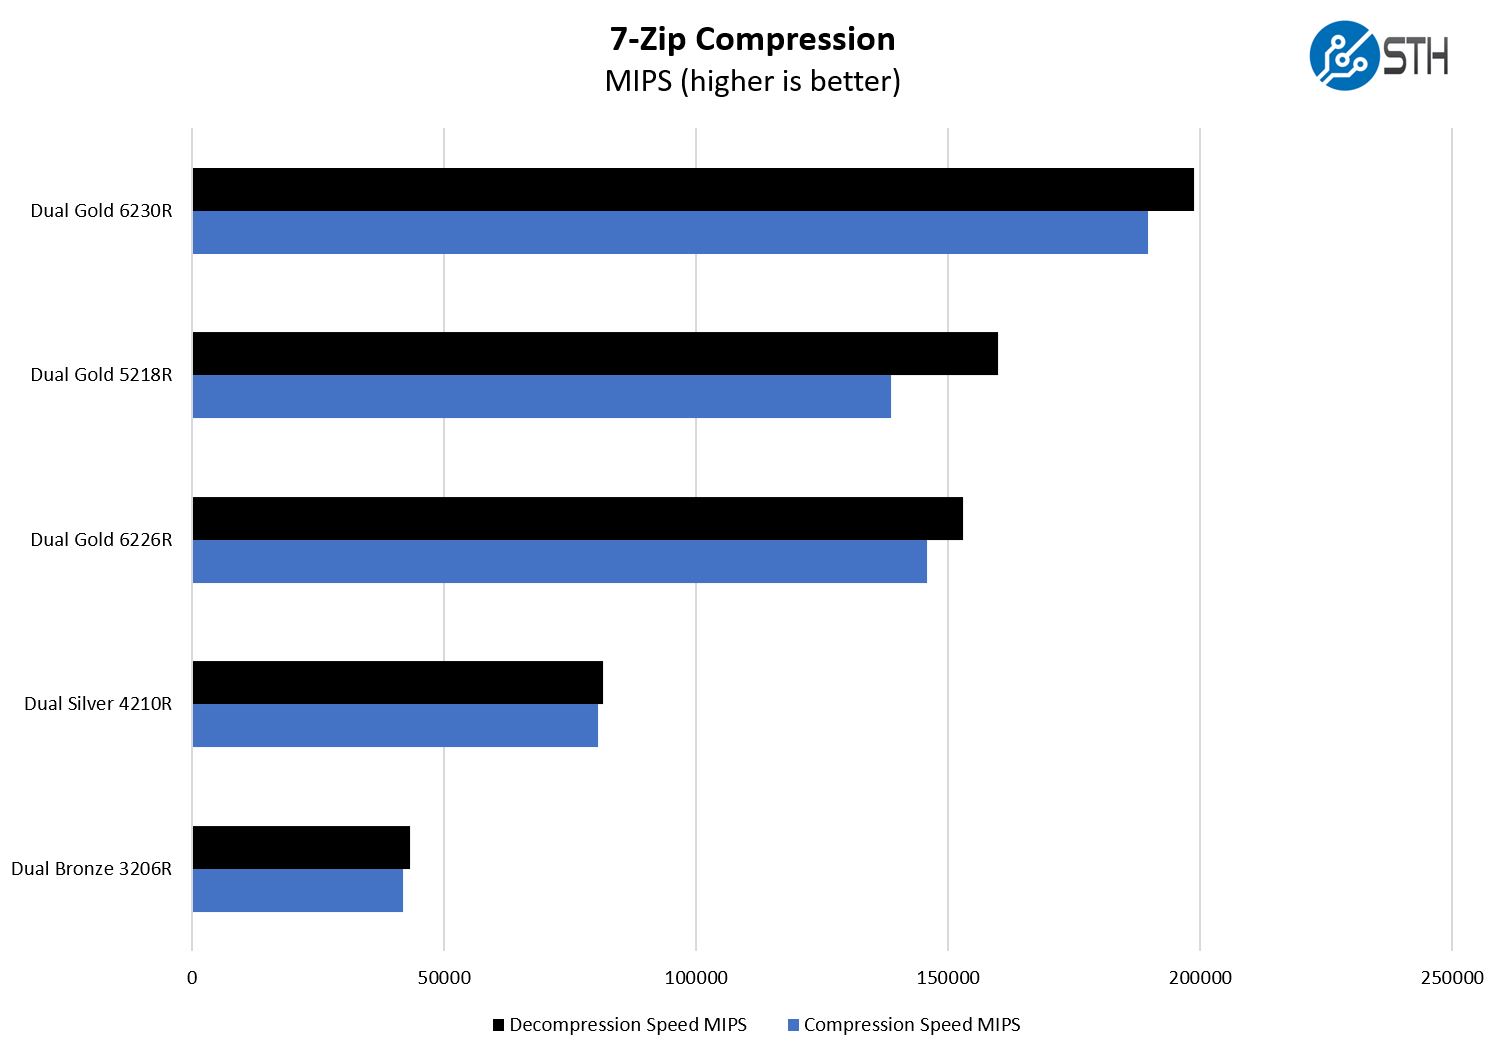
We are limited to a maximum of 165W TDP CPUs in this platform. As a result, we cannot use chips like the Intel Xeon Gold 6258R. Still, those CPUs are not going to be mainstream for the types of applications this server is designed for.
OpenSSL Performance
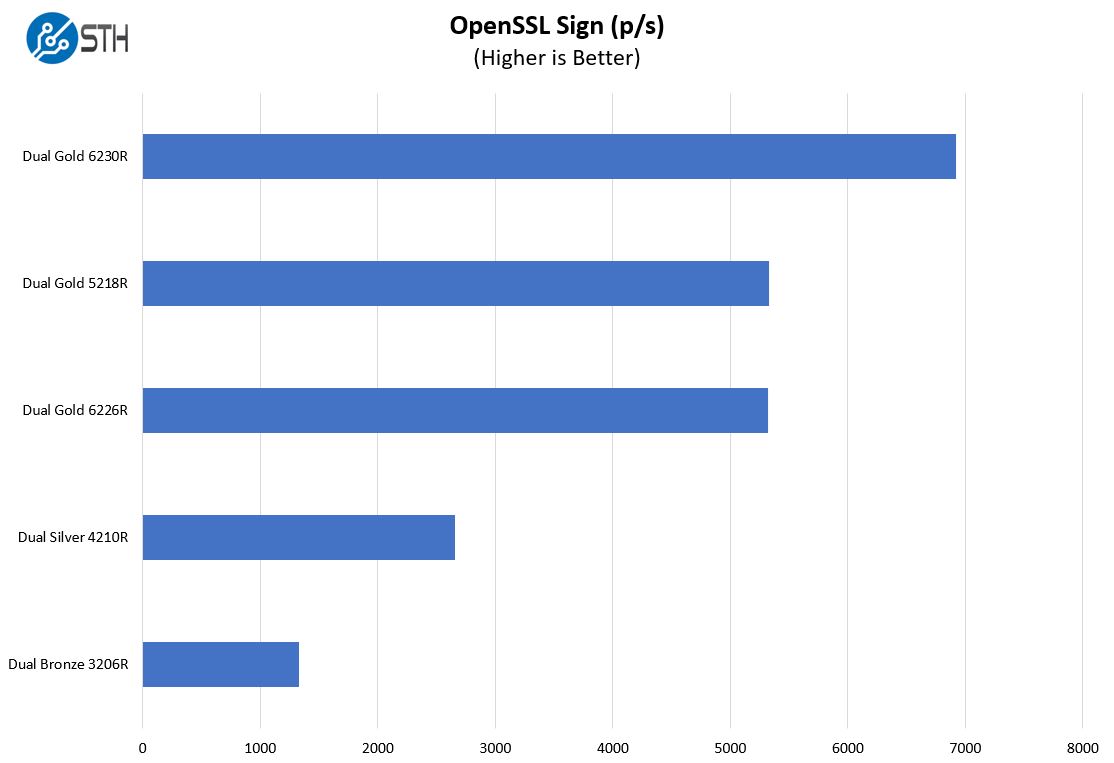
OpenSSL is widely used to secure communications between servers. This is an important protocol in many server stacks. We first look at our sign tests:
Here are the verify results:
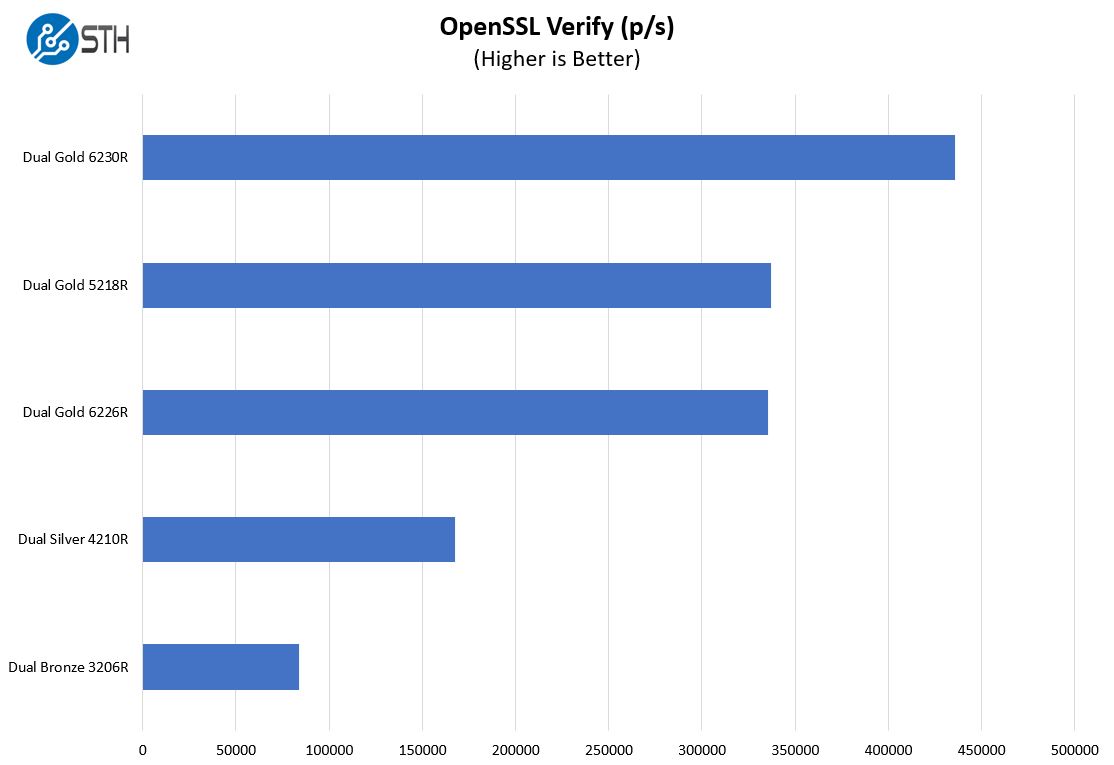
Moving up from the dual Xeon Silver to Xeon Gold 6230R setup costs around $3000. When discounts are applied and against the background of a configured system with twelve large capacity drives, this can make sense..
Chess Benchmarking
Chess is an interesting use case since it has almost unlimited complexity. Over the years, we have received a number of requests to bring back chess benchmarking. We have been profiling systems and are ready to start sharing results:
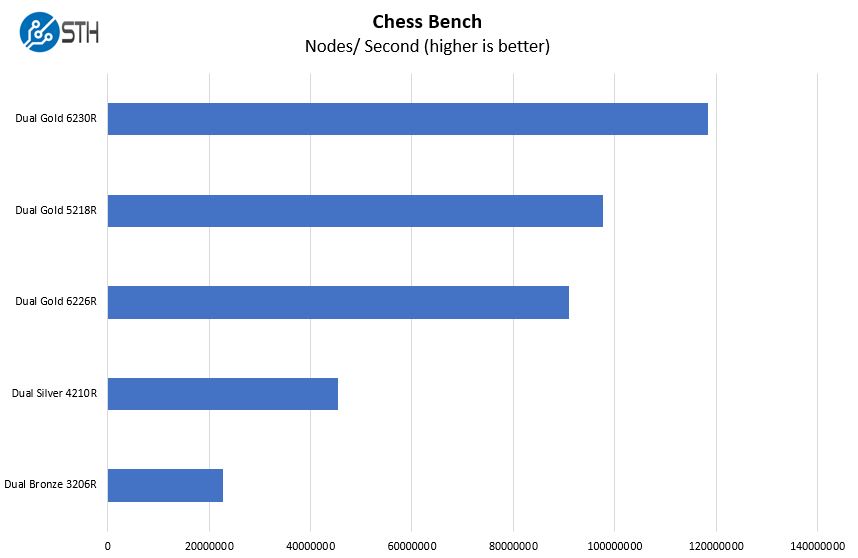
Again, we get solid results here.
SPECrate2017_int_base
The last CPU benchmark we wanted to look at is SPECrate2017_int_base performance. Server vendors get better results than we do, but this gives you an idea of where we are at in terms of what we have seen:
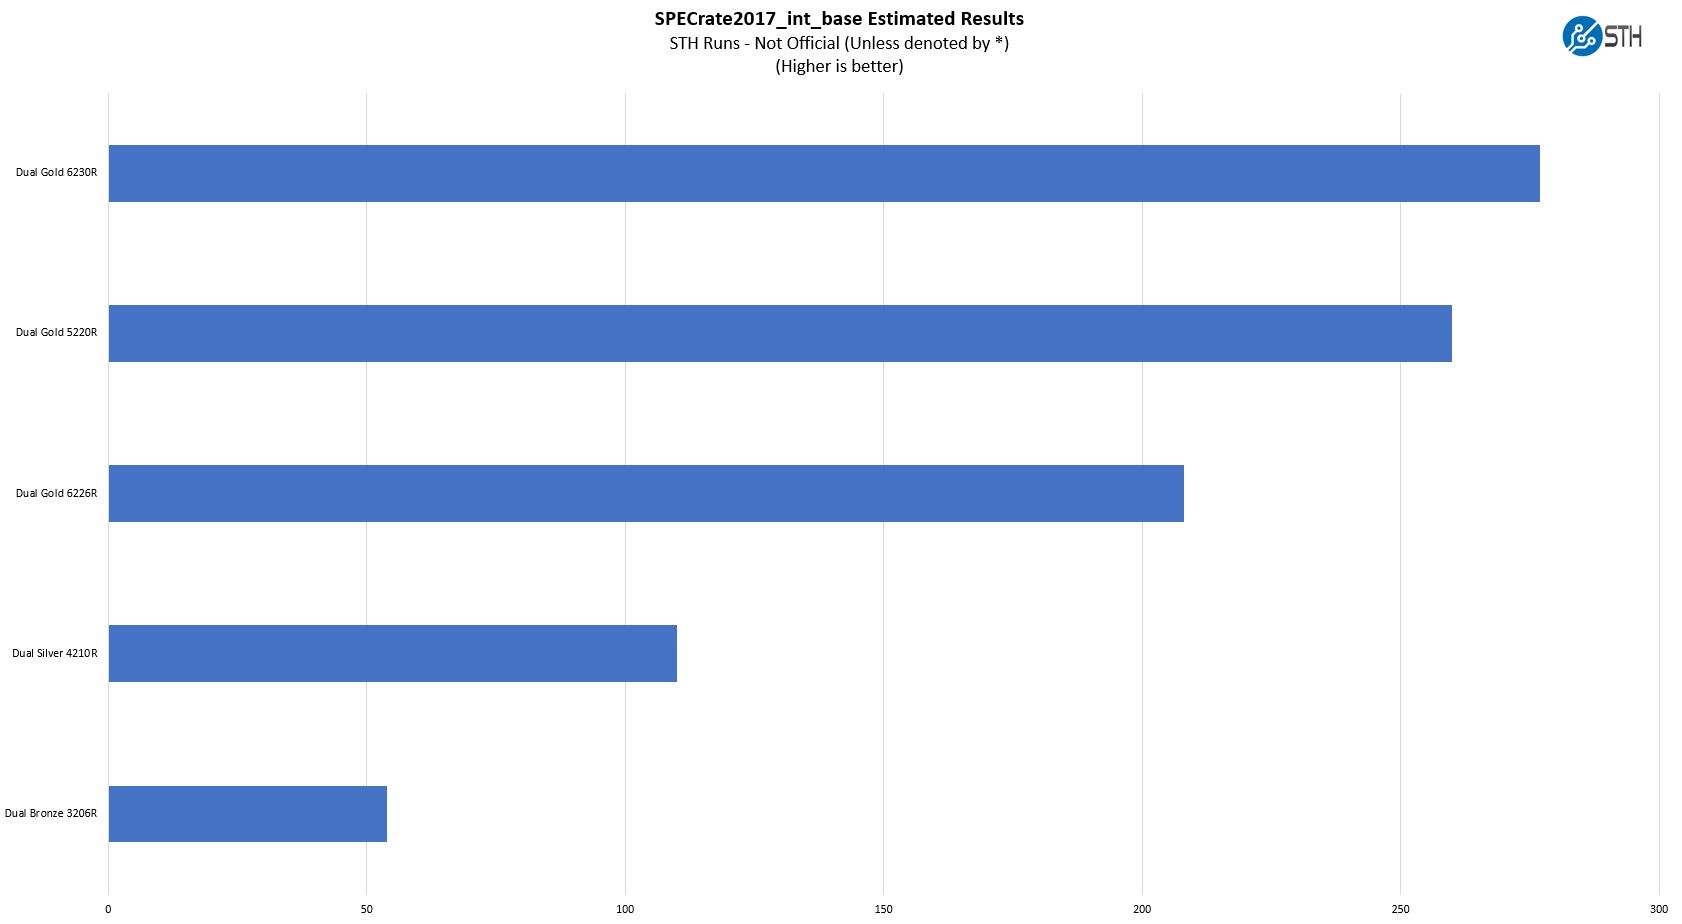
Again, these are unofficial and estimated results since they are not on the SPEC website. We do not go through the same levels of firmware/ BIOS optimization that vendors do in their runs, so our numbers should only be used to compare against STH figures, not to the broader market. We are just using these to show the relative performance that we saw in our test system.
Storage Performance
Given the system’s specs, we knew that our SATA drive array is not fast enough to saturate the onboard SAS3416 controller. Still, we wanted to provide some view.
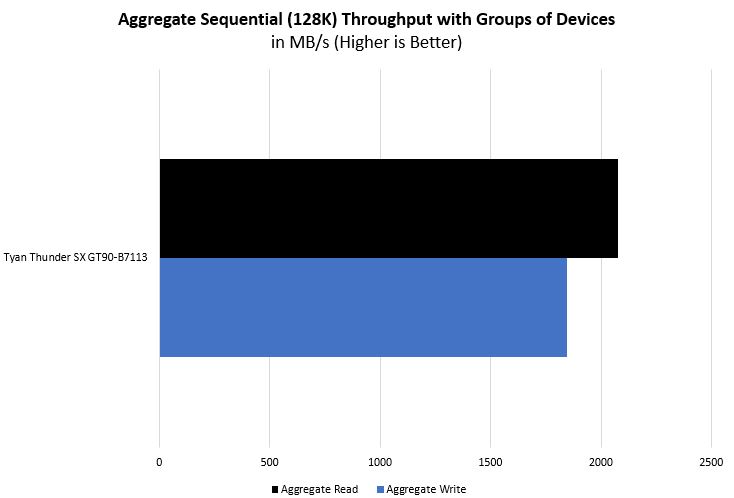
We had a solid performance on our array. Of course, many of these solutions will run scale-out storage, with NVMe caching and potentially be limited by network bandwidth. Our takeaway is that this performed as can be expected from the array.
Next, we are going to move to our power consumption, server spider, and final words.


Considering the rail design. and warning sticker, does the server feel like it might tip forward with a fully loaded drive sled pulled out all the way, if there’s nothing above it?
This design does look cool, especially with the 900mm depth. I’m a little shocked you didn’t mention the lack of hot-swap fans (and how that’s fine.)
That server is an impressive piece of work. It would be more impressive with a single EPYC socket instead of two Xeon$ocket$.