Supermicro ARS-111GL-NHR Block Diagram and Topology
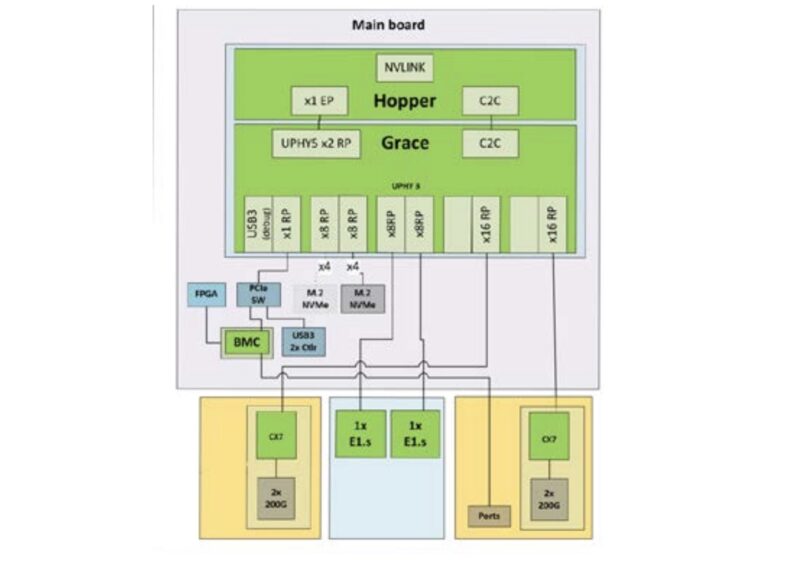
Here is the block diagram for the system. We can see that the 64 PCIe Gen5 lanes are mostly accounted for except the M.2 drives leave two x4 links unused.
The topology certainly looks a bit funky with 72 cores. We can see each core has its own 1MB L2 cache and then the reported 114MB of L3 cache. The chip is supposed to have ~117MB of L3 cache (1.625MB/ core?)

On the right we can see the PCIe roots leading to the networking and storage devices as well as the Hopper GPU that is listed as a 132 compute unit 94GB co-processor.
Next, let us quickly get to management.
Supermicro ARS-111GL-NHR Management
We mentioned in our internal overview that the system is a MGX base so we have a DC-SCM solution for the baseboard management controller.
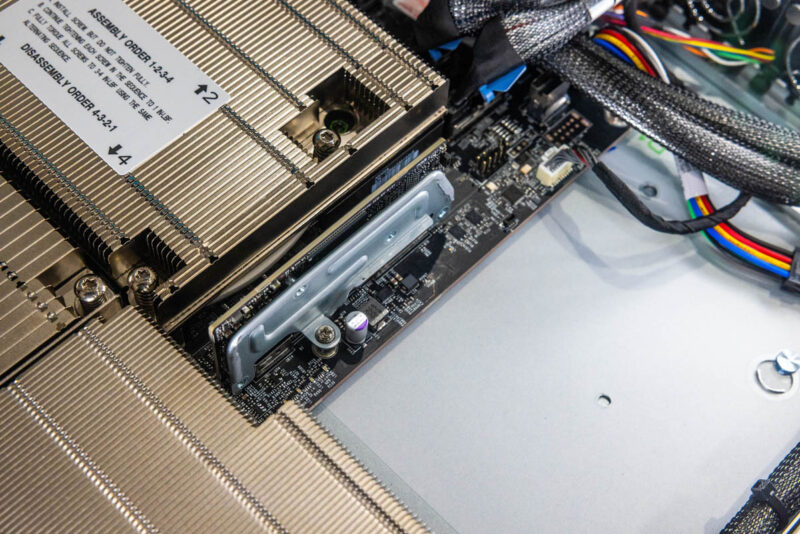
The management interface on this machine was very similar to the other management interfaces from Supermicro so you can check out any of our recent reviews to learn more about it.
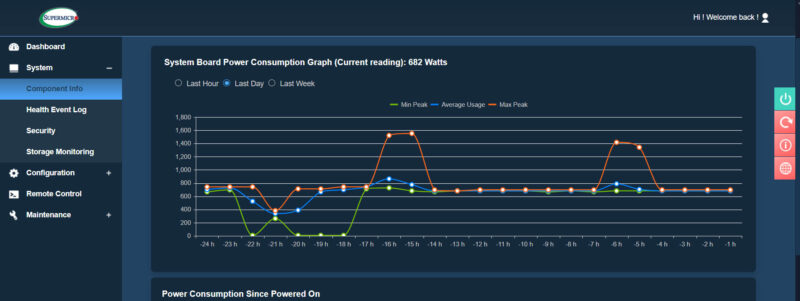
Still, for those that want to use APIs or a web interface to manage the server, this server has a normal Supermciro suite of management tools.
Supermicro ARS-111GL-NHR Performance
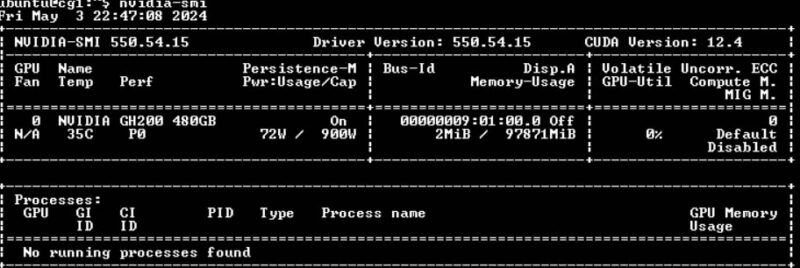
Realistically, we had a portion of an afternoon with the system so we did not get to run through a normal suite. Still, let us take a quick look at the GH200 using NVIDIA’s nvidia-smi tool. Here we can see 72W of a 900W cap being used at idle. We can also see we are using a GH200 with a 480GB Grace CPU and a 94GB / 96GB Hopper GPU.
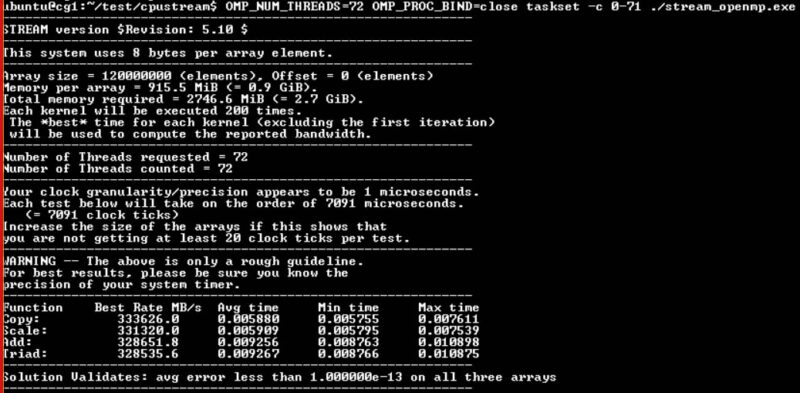
NVIDIA claims the GH200 can do 512GB/s but we saw a much lower figure. We went into why in our recent A Quick Introduction to the NVIDIA GH200 aka Grace Hopper piece. Since we have the 480GB model, we are limited to 384GB/s. In practice, we saw 325GB/s to almost 350GB/s. Just for comparison, the AMD EPYC 9004 “Genoa” launched in 2022 with DDR5-4800 gets around 250GB/s on a similar benchmark with 12 channels filled. We expect the next-gen AMD EPYC “Turin” to close this memory bandwidth gap at higher memory capacities next quarter when it adopts newer DDR5. Intel will also vastly eclipse the 350GB/s figure and likely the 512GB/s figure of lower capacity GH200 parts using MCR DIMMs in a few weeks with the Intel Xeon 6 Granite Rapids-AP parts.
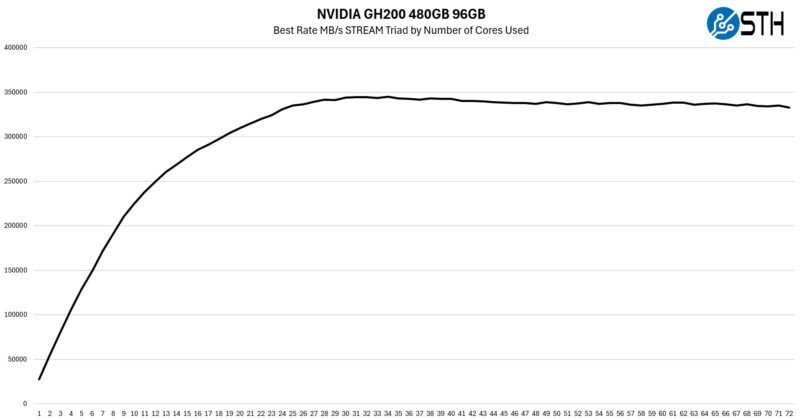
Still, since we were on limited time, and the memory bandwidth is a big selling point, we did a quick test of the GH200 480GB to see how many cores it takes to achieve that memory bandwidth. Peak memory bandwidth was in the 31-34 core range.
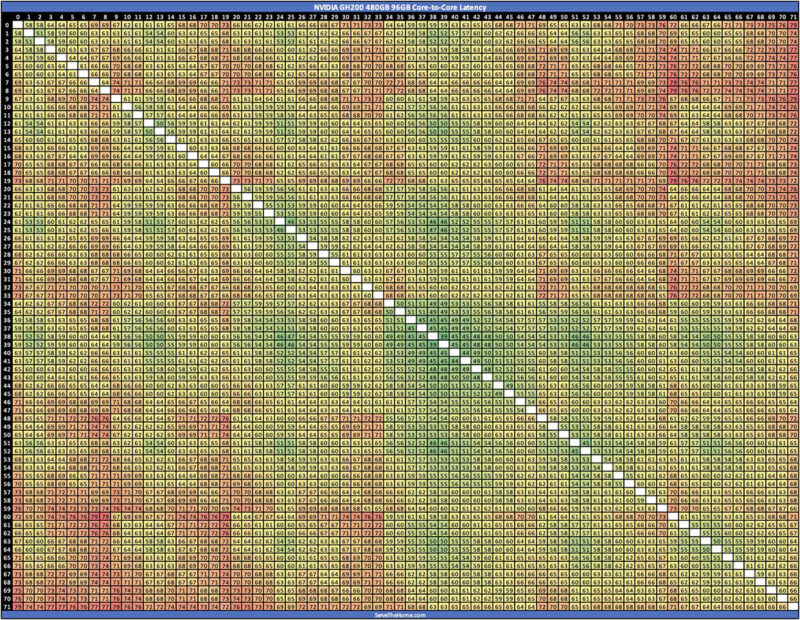
We also did a core-to-core latency mapping that took a long time to run. This eye chart was great in the lower-core count era, but Turin Dense and Sierra Forest AP are going to take a really long time to run.
For the Hopper GPU side, here is GPU Stream:

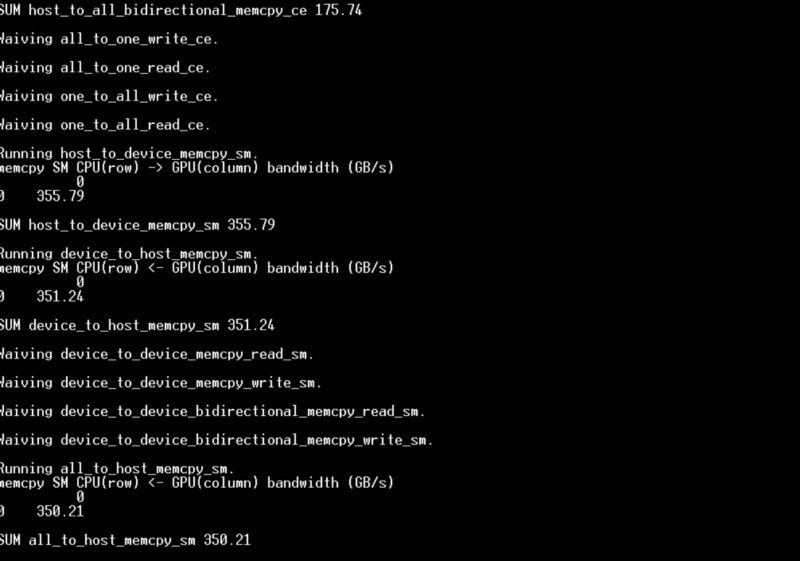
We also ran NVBandwidth which is in some ways similar to Intel’s MLC. Here we can see CPU to GPU bandwidth over the NVLink-C2C as an example:
Here is a double precision CUDA FFT bench.

It would have been cool to get to get a few weeks with the system, but it was heading to be used by a customer. Still, it was fun getting some data off of it.
If you wanted to compare the CPU to your desktop using something simple like Geekbench 5, the result there was just under 75K. There is a lot more performance per core but less performance per CPU than an AmpereOne 192 core that is just shy of 80K (and likely could get there.)
Next, let us get to power consumption and noise before moving on.

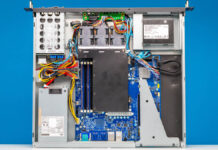
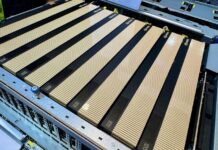

“You might notice these two pieces of metal” but you’ll have to click through to substack to discover what they are!
Maybe the clickbait shouldn’t come at the cost of making the article incomplete?
@A Concerned Listener – They are not being used in this system and it is an entirely different topic that was almost as big as this entire review.
I know folks may not love the fact that we have multiple publications now, but a lot of work is happening to decide what goes on the main YouTube channel versus short-form and STH versus Substack. We will not always get it right, but that is a very different topic since it is not in this server.
I can’t make sense of the spider graph for this system, how does this rank higher for networking density than GPU Density? Also adding to the above regarding the clickbait, that’s not why we come to STH
I’m subbed to the Substack via my company. It’s like another STH less about the hardware and more about the business of what’s going on through the lens of hardware. I’m enjoying it so far. I’ve been reading STH for more than a decade so I’m happy to spend some of my subscription allocation on supporting them. I’d rather do that and get exclusive content then see STH turn into Tomshardware with spammy auto-play video ads.
I’ll just tell you, the paywalled article that links to is worth the monthly sub alone to me. It’s a great PK article that I didn’t know about.
I don’t understand why people are complaining. They’re promoting another pub they have and this is longer than their average server review so it’s not like they took half of a review away.
I’m getting approval to sub at work.
Accolades belong to the STH team for this review. With this and last week’s GH200 I’m learning too much here so thanks