Samsung 9100 PRO 2TB Performance Testing
We test using both the default smaller test size and larger test sets on our benchmarks. This allows us to see the difference between lighter and heavier workloads.
CrystalDiskMark x64
CrystalDiskMark is used as a basic starting point for benchmarks as it is something commonly run by end-users as a sanity check.
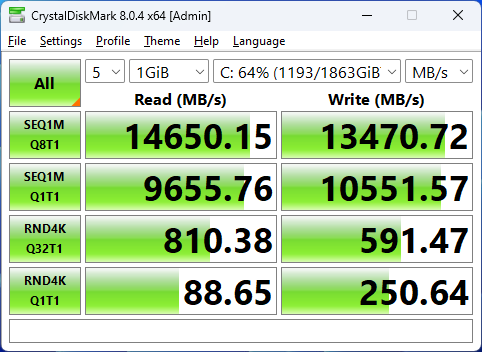
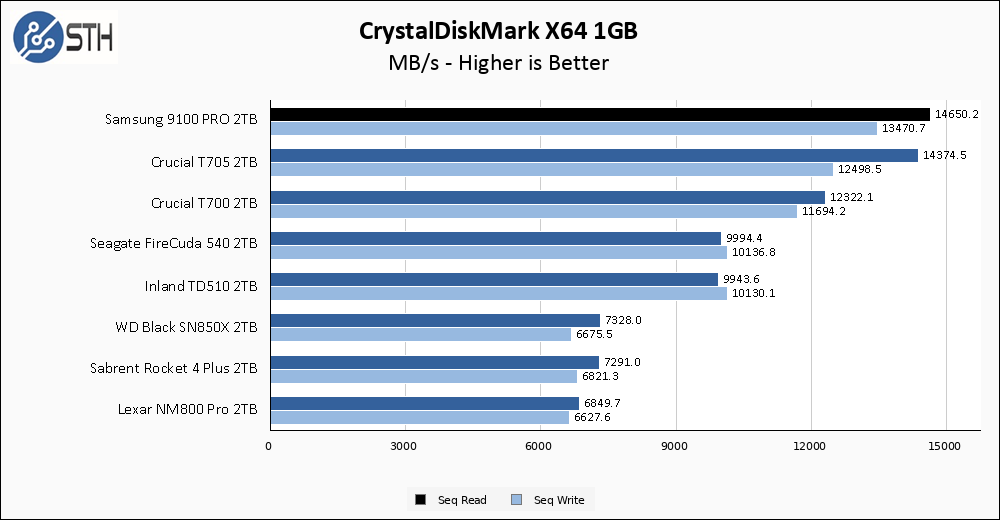
The Samsung 9100 PRO 2TB promised 14700 MB/s read and 13400 MB/s write, and it basically got there. Both read and write performance edge out the Crucial T705, which is the only drive I have tested thus far that gives the 9100 PRO any competition. You might want to get used to seeing the 9100 PRO at the top of the charts.
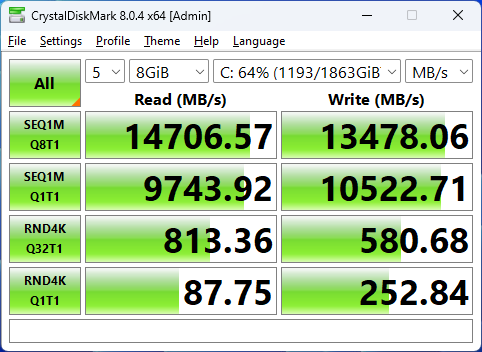
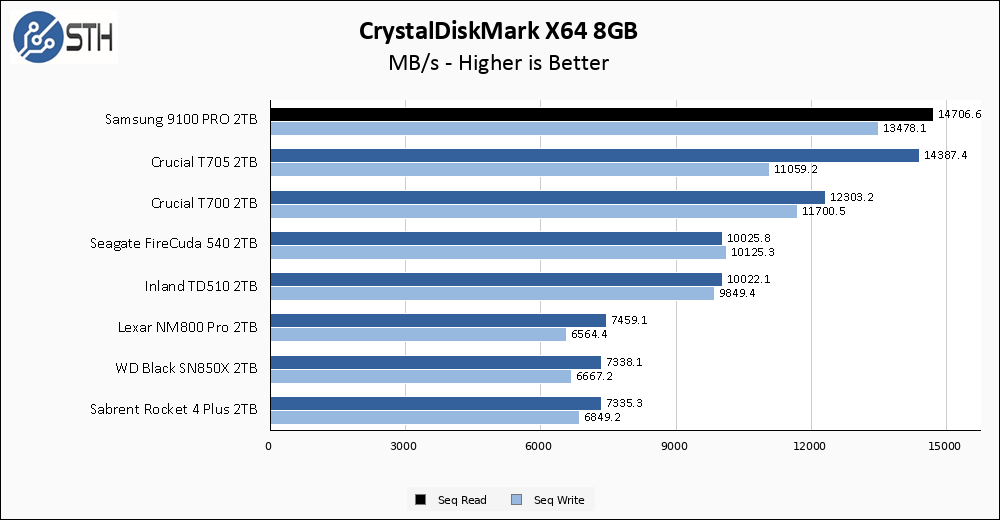
The larger CrystalDiskMark test shows the 9100 PRO hold strong to its performance targets, once again essentially nailing its rated specifications. Write performance in this test dipped slightly on the T705, and the 9100 PRO does not exhibit that behavior allowing the relative gap in write performance to extend.
ATTO Disk Benchmark
The ATTO Disk Benchmark has been a staple of drive sequential performance testing for years. ATTO was tested at both 256MB and 8GB file sizes.
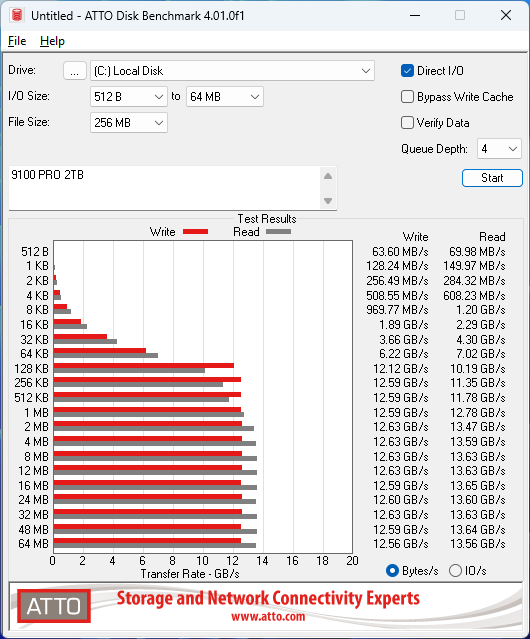
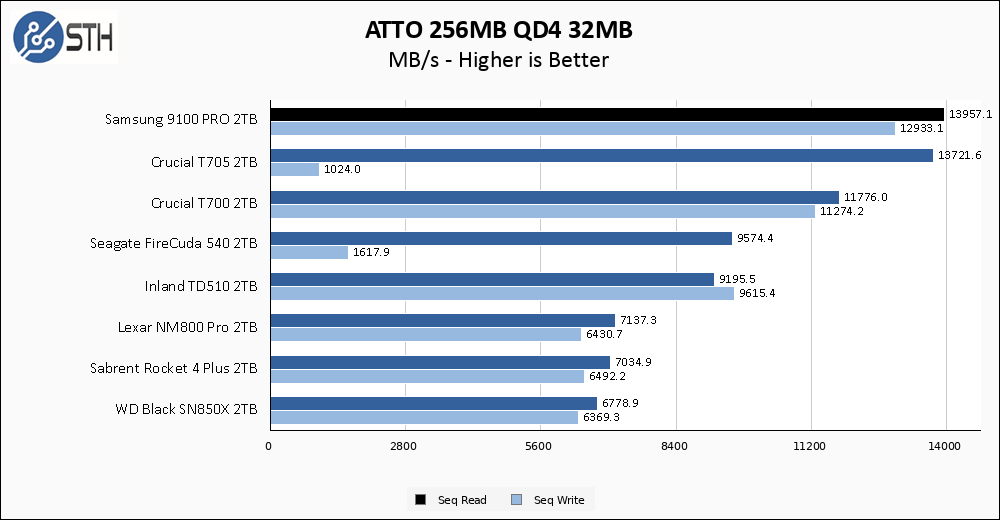
ATTO sequential results are spectacular across the board. The Samsung 9100 PRO turns in the best read and write performance I have ever seen in ATTO, and is entirely consistent across the breadth of the test. The T700, T705, and FireCuda 540 were all far less consistent.

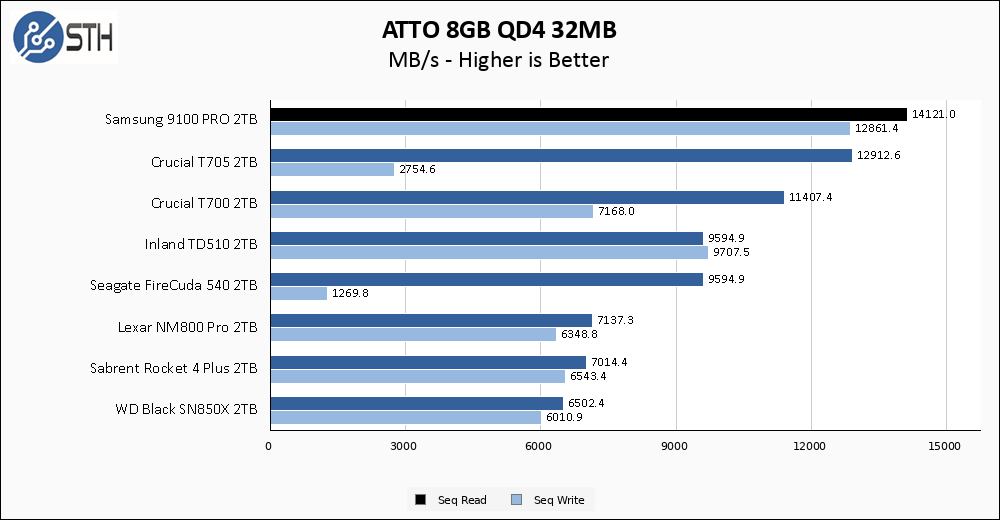
The larger ATTO test does not phase the 9100 PRO one bit, which is not something that can be said for many of the other drives on my chart. Performance is in lockstep with the smaller test, and there is zero inconsistency in the results across the span of the test.
Anvil’s Storage Utilities
Anvil’s Storage Utilities is a comprehensive benchmark that gives us a very in-depth look at the performance of the drives tested. This benchmark was run with both a 1GB and 8GB test size.

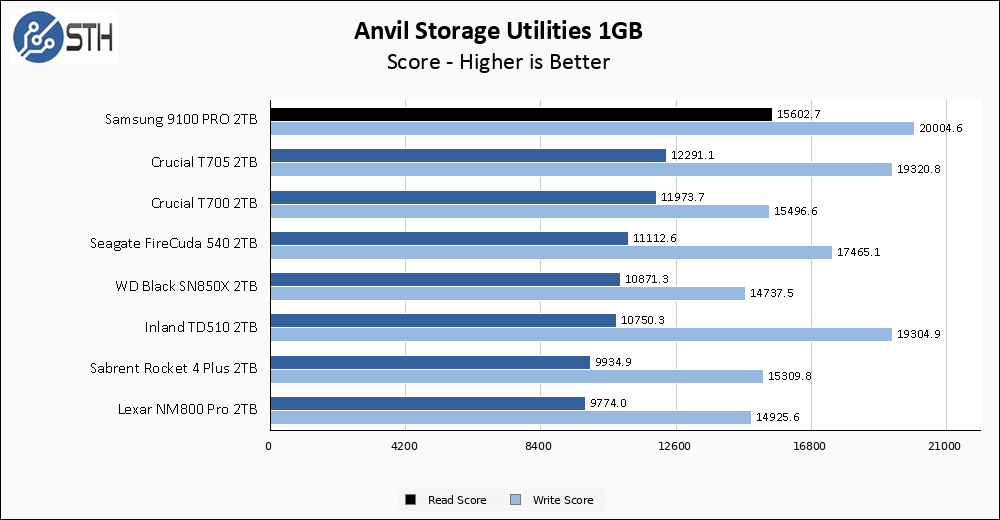
I said you should get used to seeing the Samsung at the top of the charts, and Anvil results for the Samsung 9100 PRO 2TB continue that trend. Write score is the highest I have ever seen, and read score only loses to the Optane P5800X, which is not on the graph as it is an entirely different class of product.
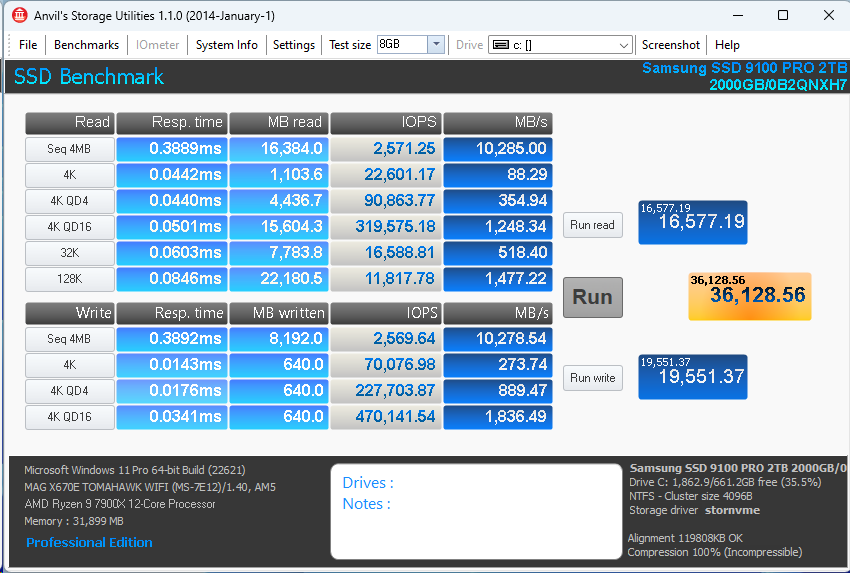
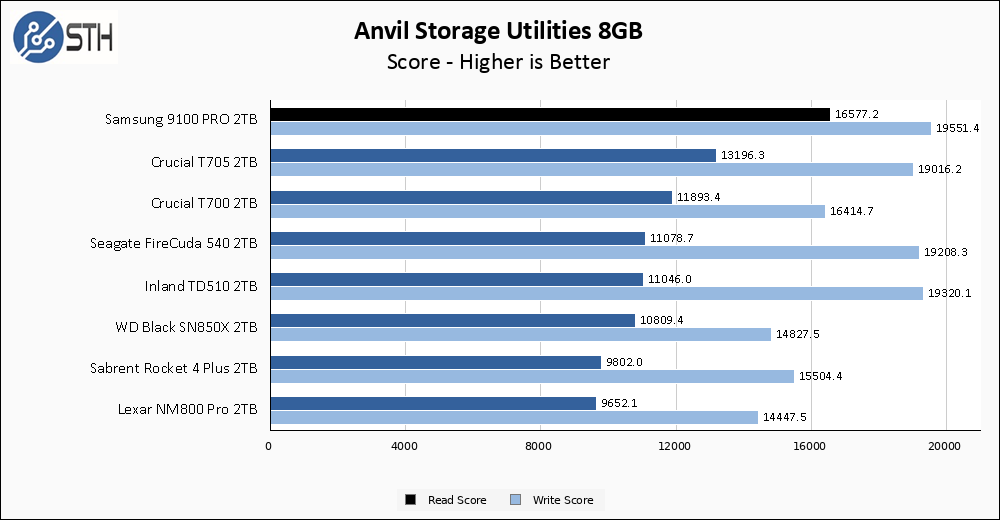
The larger Anvil test shows the 9100 PRO holding its position atop the chart, and indeed among the best I have ever tested. Best-ever write score and second-only-to-Optane read score is the trend here.
AS SSD Benchmark
AS SSD Benchmark is another good benchmark for testing SSDs. We run all three tests for our series. Like other utilities, it was run with both the default 1GB as well as a larger 10GB test set.
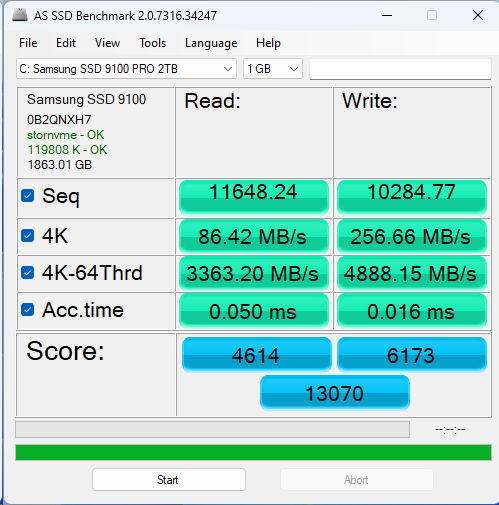
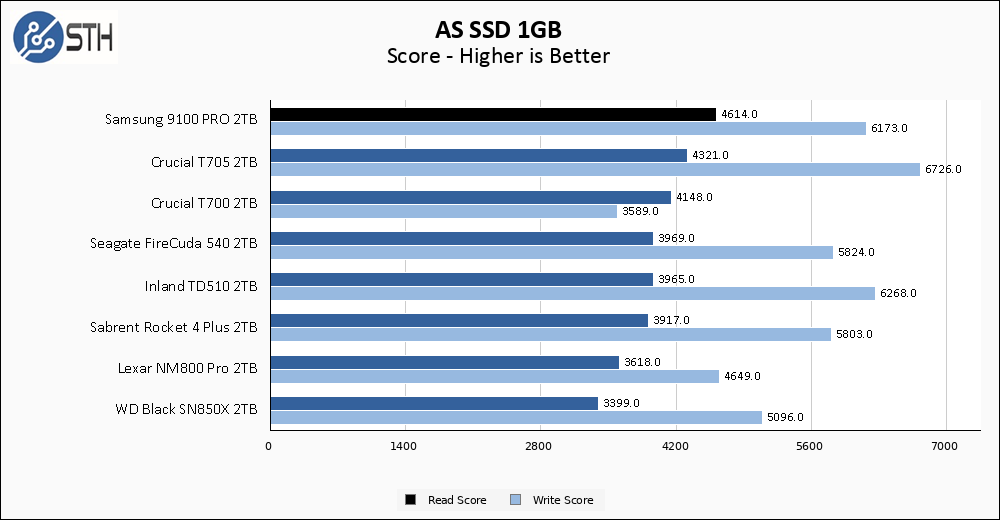
AS SSD shows a rare result where the 9100 PRO is not uncontested at the top of my chart. Read score is the best non-Optane result I have ever seen, but write score loses slightly to a few of the Gen5 Phison drives by a small margin.
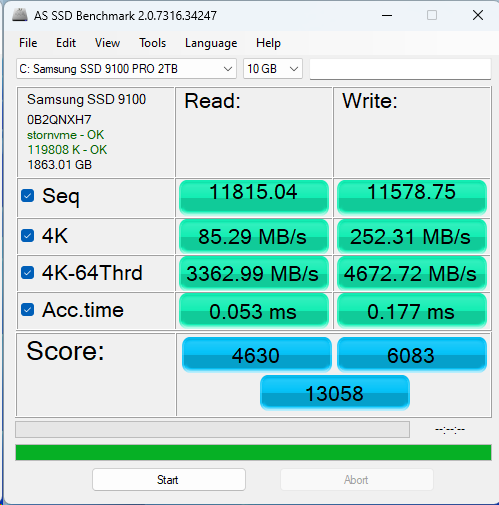
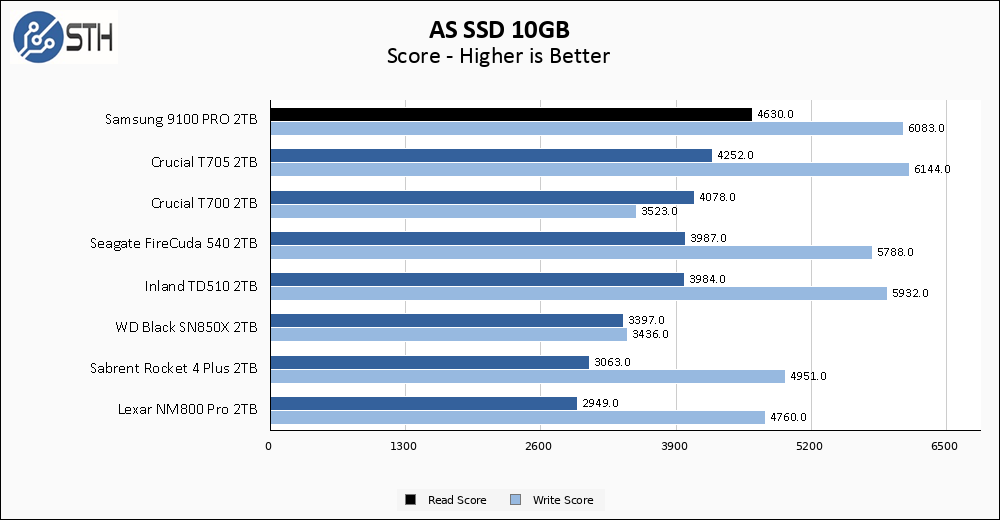
Holding a steady score moving to the larger AS SSD test is fairly rare, and the 9100 PRO manages to accomplish it. Read score again remains top, with write score coming out slightly behind the T705.
SPECworkstation, thermals, and our conclusion are up next.


Nice results!
I’m kind of curious what a hyper-fast PCIe 5.0 device like this would look like in a PCIe 4.0 slot. Would it get ~identical read and write speeds (as it’s clearly capable of much higher rates than PCIe 4.0 can provide), or would it end up looking similar to high-end PCIe 4.0 devices, still with reads higher than writes?
Hopefully this one doesn’t go down to 1GB/s after 2 seconds of use like the 990 Pro.
This or an Optane P5800X as boot drive ?