NVIDIA Quadro P2200 Compute Related Benchmarks
We are going to compare the Quadro P2200 to our growing data set of GPUs both professional and consumer. Since this is STH, we are focused on compute performance rather than gaming performance.
Geekbench 4
Geekbench 4 measures the compute performance of your GPU using image processing to computer vision to number crunching.
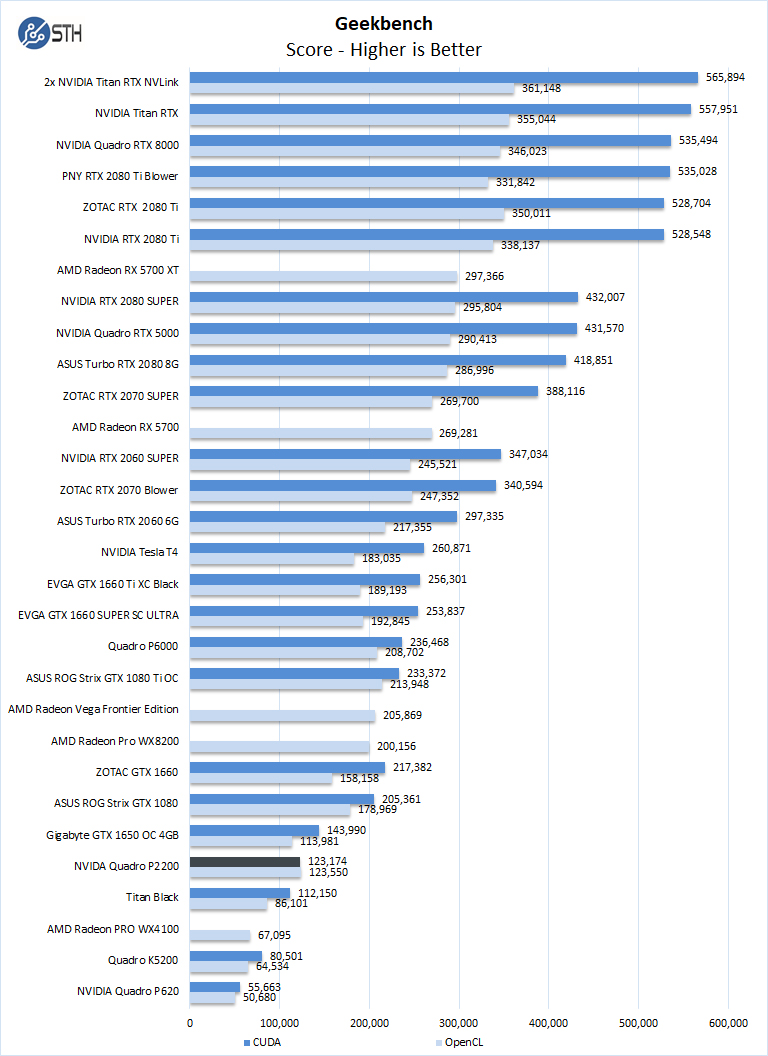
Our first compute benchmark, and we see the Quadro P2200, achieve results close to GTX 1650 4GB OC, which is a dual-slot graphics card that uses more power.
LuxMark
LuxMark is an OpenCL benchmark tool based on LuxRender.
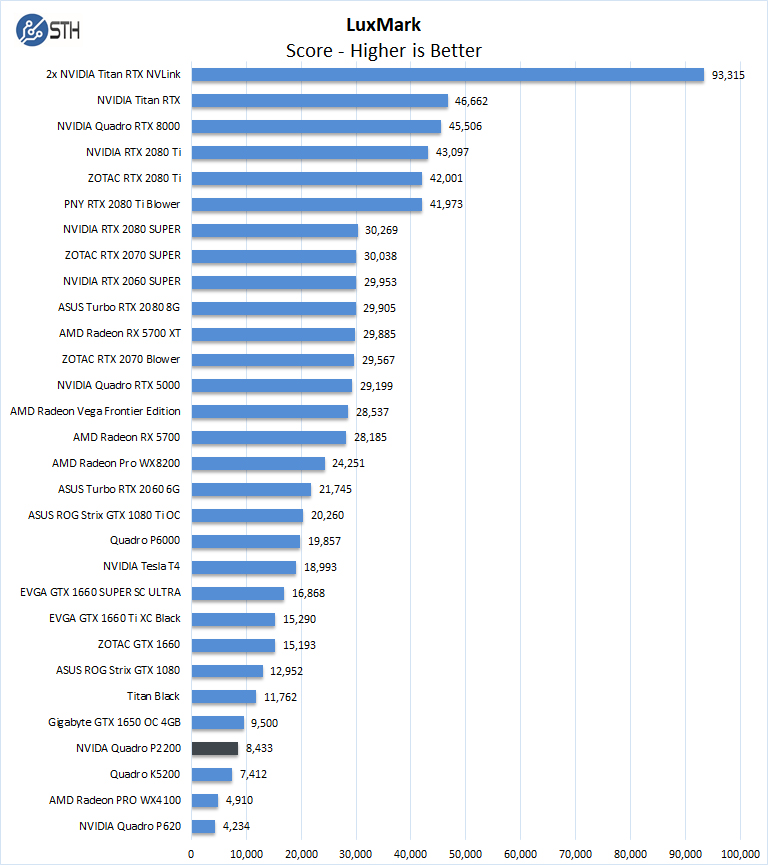
With LuxMark, we generally find the dual-fan cooler GPU’s have a performance edge. In the case of the Quadro P2200, we see the single-fan blower type cooler holds up well.
AIDA64 GPGPU
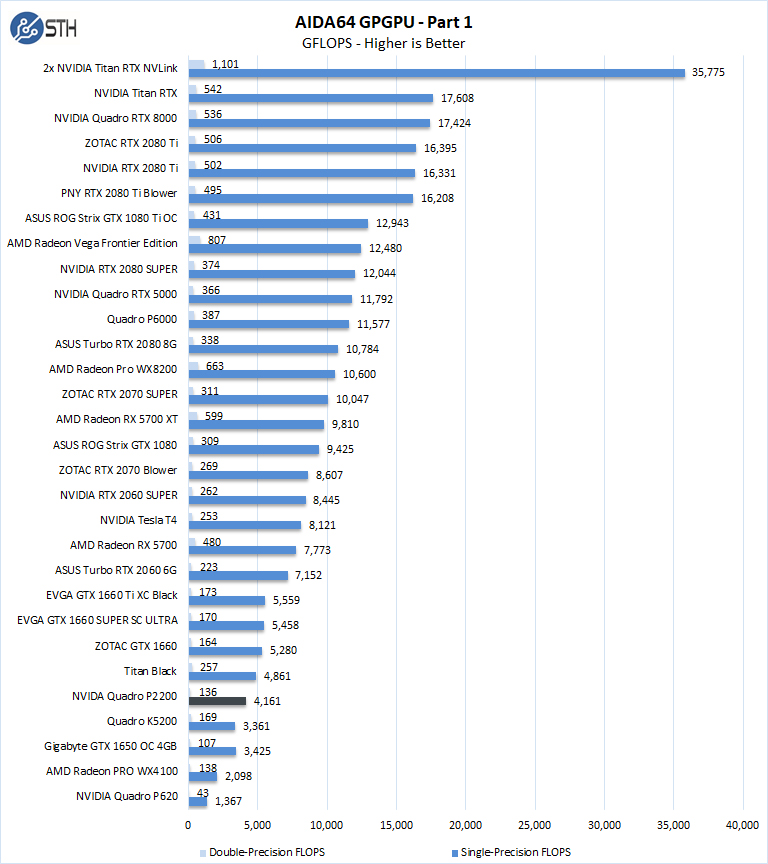
These benchmarks are designed to measure GPGPU computing performance via different OpenCL workloads.
- Single-Precision FLOPS: Measures the classic MAD (Multiply-Addition) performance of the GPU, otherwise known as FLOPS (Floating-Point Operations Per Second), with single-precision (32-bit, “float”) floating-point data.
- Double-Precision FLOPS: Measures the classic MAD (Multiply-Addition) performance of the GPU, otherwise known as FLOPS (Floating-Point Operations Per Second), with double-precision (64-bit, “double”) floating-point data.
The next set of benchmarks from AIDA64 are:
- 24-bit Integer IOPS: Measures the classic MAD (Multiply-Addition) performance of the GPU, otherwise known as IOPS (Integer Operations Per Second), with 24-bit integer (“int24”) data. This particular data type defined in OpenCL on the basis that many GPUs are capable of executing int24 operations via their floating-point units.
- 32-bit Integer IOPS: Measures the classic MAD (Multiply-Addition) performance of the GPU, otherwise known as IOPS (Integer Operations Per Second), with 32-bit integer (“int”) data.
- 64-bit Integer IOPS: Measures the classic MAD (Multiply-Addition) performance of the GPU, otherwise known as IOPS (Integer Operations Per Second), with 64-bit integer (“long”) data. Most GPUs do not have dedicated execution resources for 64-bit integer operations, so instead, they emulate the 64-bit integer operations via existing 32-bit integer execution units.
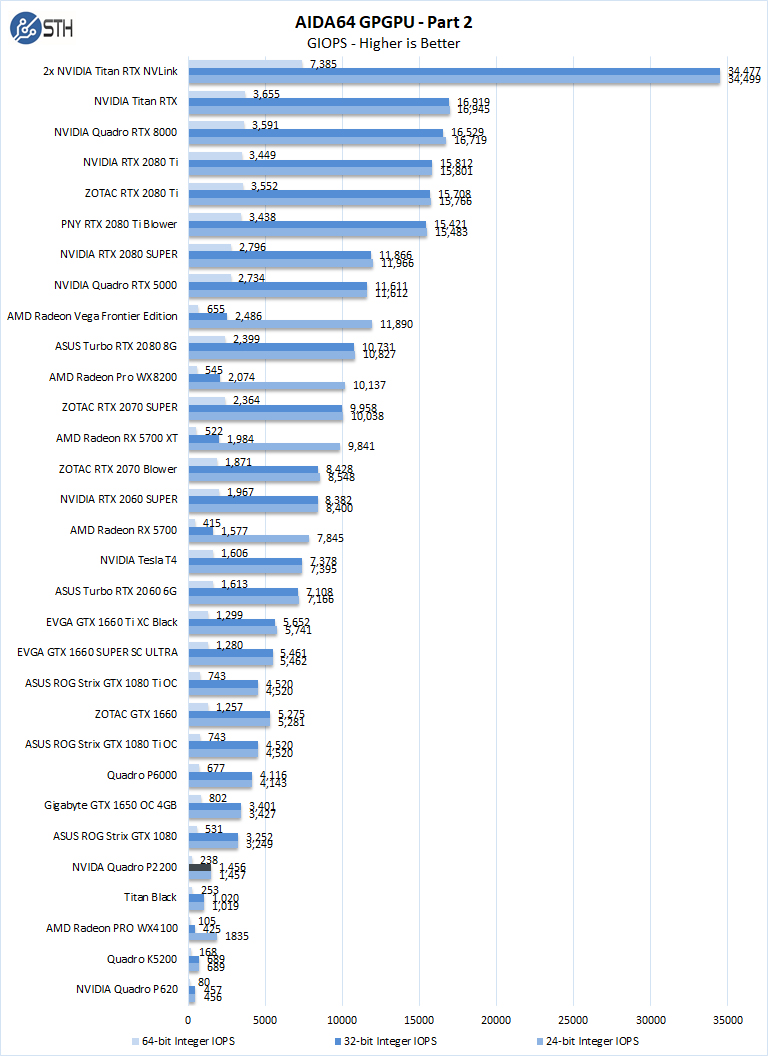
The take away here is the NVIDIA Quadro P2200 falls a bit behind the GTX 1650 OC and more closely matches the Titan Black at much lower power.
hashcat64
hashcat64 is a password cracking benchmarks that can run an impressive number of different algorithms. We used the windows version and a simple command of hashcat64 -b. Out of these results, we used five results to the graph in our charts. Users who are interested in hashcat can find the download here.
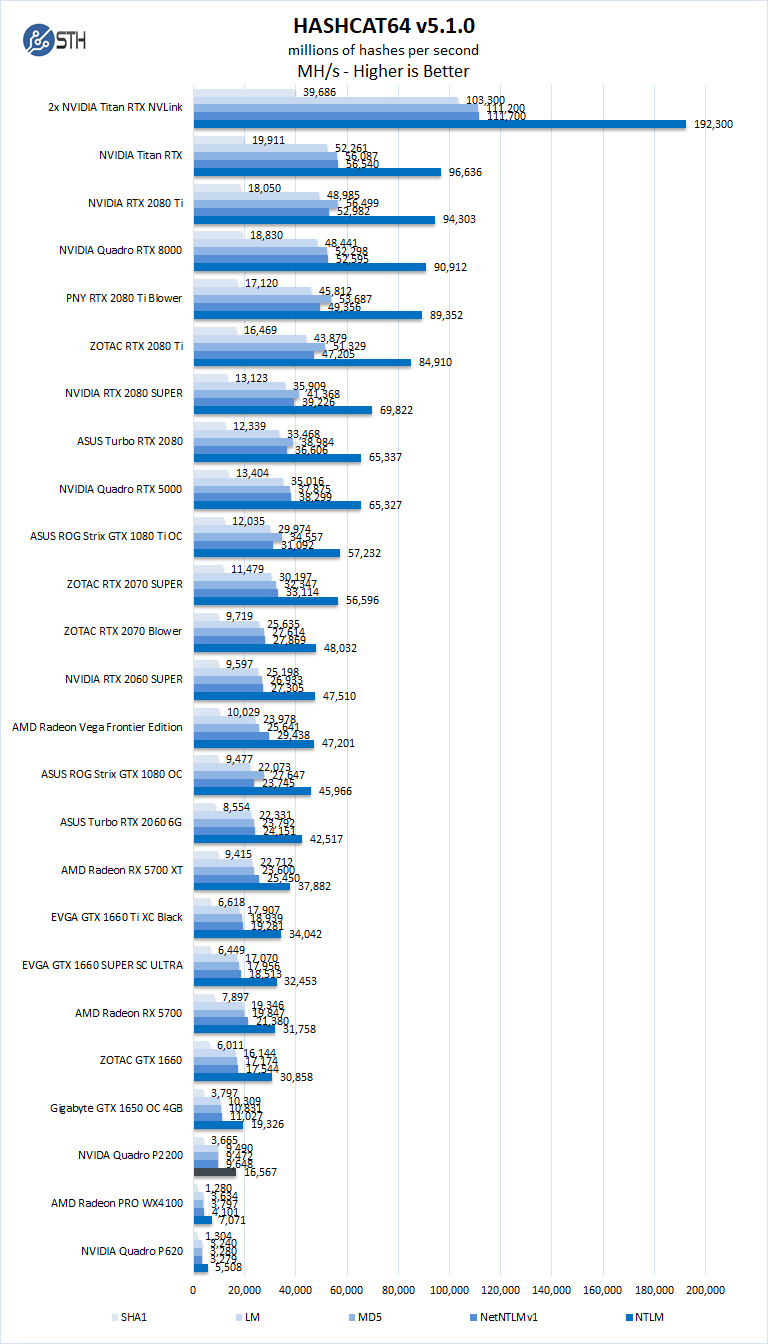
Hashcat can out a heavy load on GPU’s, and here we see the dual-fan graphics cards have the edge in our results.
SPECviewperf 13
SPECviewperf 13 measures the 3D graphics performance of systems running under the OpenGL and Direct X application programming interfaces.
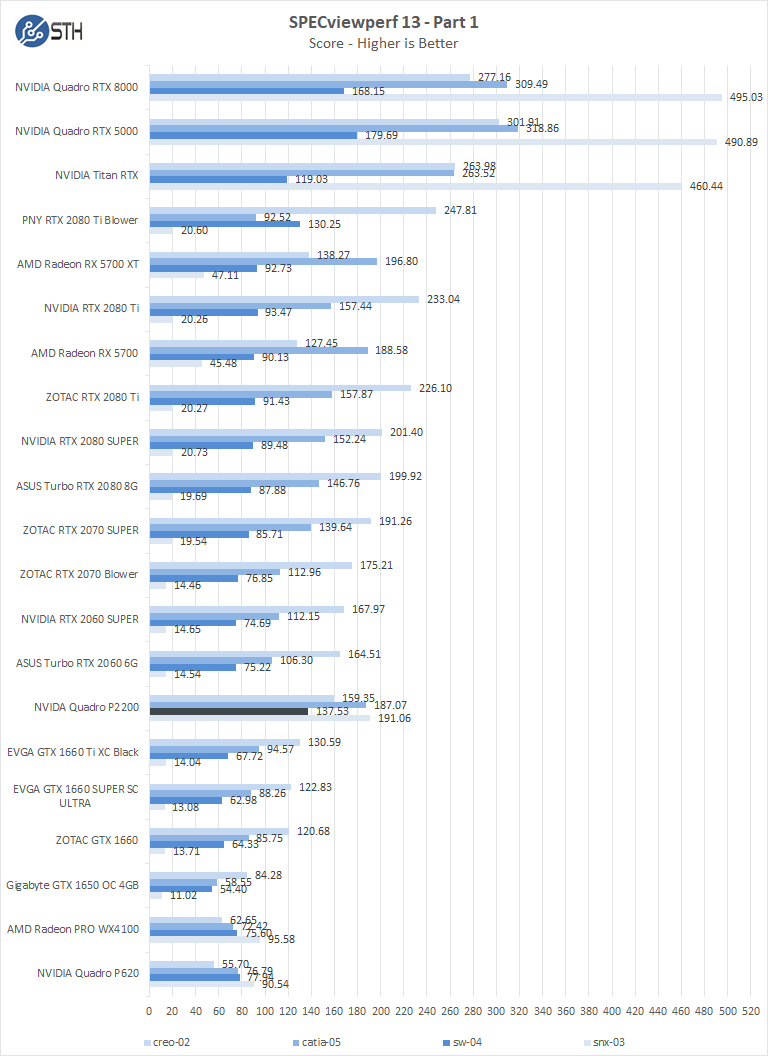
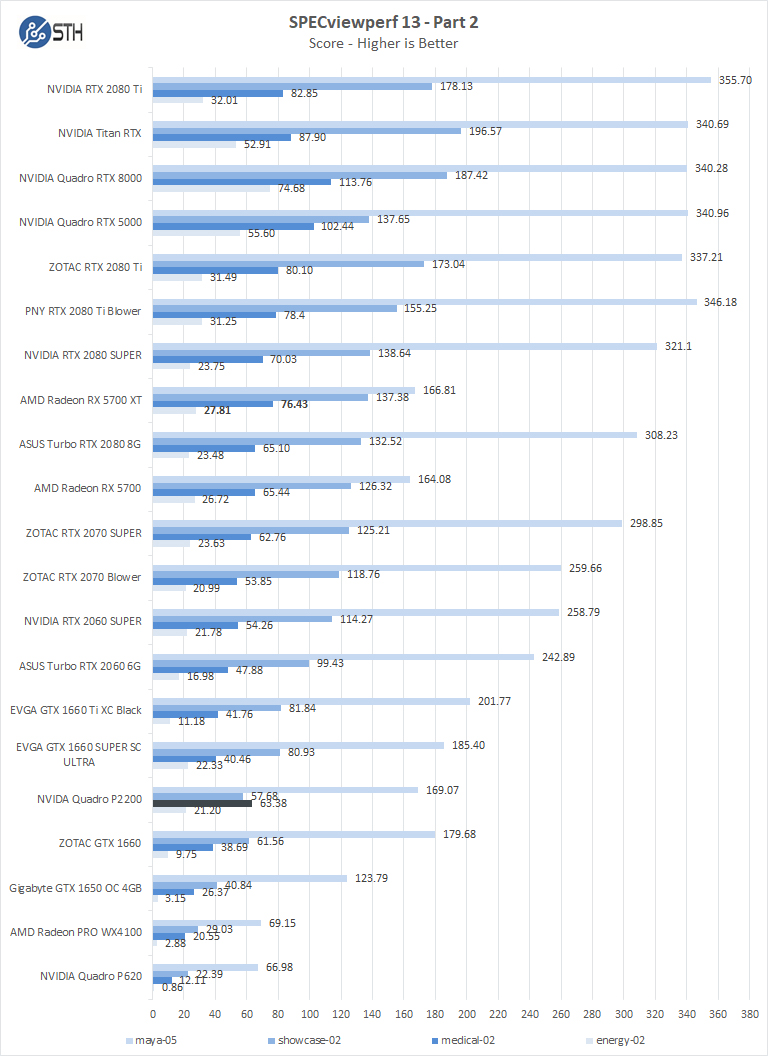
In SPECviewperf, the NVIDIA Quadro P2200 surpasses the GTX 1650 OC in many segments.
Let us move on and start our new tests with rendering-related benchmarks.

Wouldn’t a better test have been to include the Quadro P2000, which this seems to be an iteration of ?
Evan – we did not have a Quadro P2000 and frankly, I did not want to go to older parts.
One important use case of these 75W cards is transcoding media from one format to another. It is the cheapest Nvidia card that can transcode media without artificial limitation to two streams.
I have both P2000 and P2200… the difference in performance is ~5-10% depending on benchmark.
But it’s a moot point… since the P2000 and P2200 cost the same and have the exact same feature set and power/thermal budget everyone should just buy the P2200.
Many of the customers are just using it for video transcoding anyway.
The P2000 is also no longer coming off the production line.