NVIDIA GeForce RTX 2060 Super Specifications
Here are the key specifications for the NVIDIA GeForce RTX 2060 Super Founders Edition:
- CUDA Cores: 2176
- Tensor Cores: 272
- RTX-OPS Cores: 41T
- Texture Units: 136
- Base Clock Rate: 1490 MHz
- GPU Boost Rate: 1650 MHz (OC)
- Memory Capacity: 8GB GDDR6
- Memory Speed: 1470 MHz
- Memory Bandwidth: 448 GB/s
- Memory Interface Width: 256-bit
- ROPs: 64
- TDP: 175W
- Max Resolution: 7680×4320
- Card Dimensions: 4.435″ x 9″
- Width: 2-Slot
This is nowhere near the dual NVIDIA Titan RTX level of power, cost, or performance, but it is important nonetheless. Not everyone that is interested in GPU compute has the means to purchase a high-end setup. One of NVIDIA’s key differentiators is the ability to make CUDA programming accessible to a wider audience. It can scale performance and capability to a user’s budget which means as someone becomes more proficient in CUDA, they can get hardware to match up to the largest supercomputers.
Here is a quick table of the current NVIDIA GeForce RTX family reflecting the older cards and the original GeForce RTX 2060’s move to the $349 price range.

Again, if you are running deep learning and AI workloads, you will want the RTX 2080 Ti (or Titan RTX) if funds permit. If they do not, we have benchmarks showing what you can expect.
Testing the NVIDIA GeForce RTX 2060 Super
Here is our test configuration for our GPUs. Note, we are using fairly pricey Intel Xeon Scalable CPUs which would be more commonly found in a server rather than a desktop.
• Motherboard: ASUS WS C621E SAGE Motherboard
• CPU: 2x Intel Xeon Gold 6134 (8 core / 16 Threads)
• GPU: NVIDIA GeForce RTX 2060 SUPER
• Cooling: Noctua NH-U14S DX-3647 LGA3647
• RAM: 12x MICRON 16GB Low Profile
• SSD: Samsung PM961 1TB
• OS: Windows 10 Pro Workstation
Here is the obligatory GPU-Z shot of the NVIDIA GeForce RTX 2060 Super:
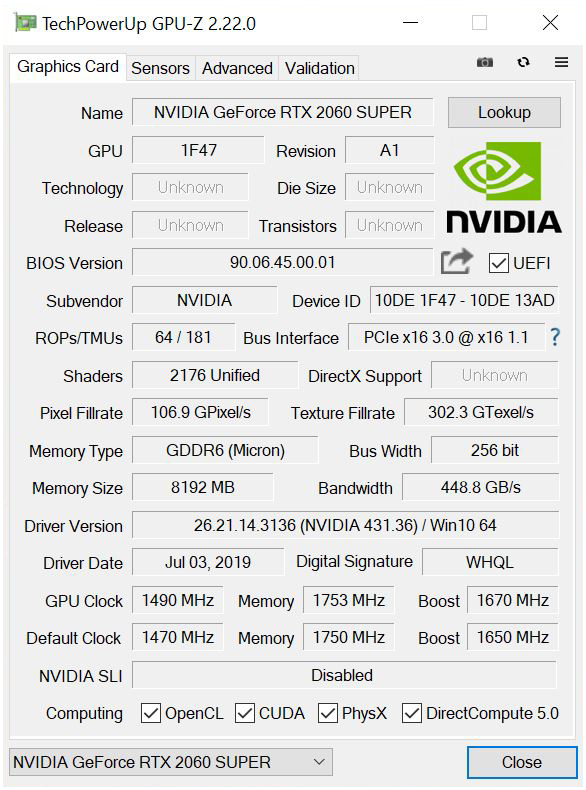
GPU-Z shows the primary stats of our testing the NVIDIA GeForce RTX 2060 SUPER. The GPU clocks in at 1490MHz and can boost up to 1670MHz. Pixel Fillrates run at 106.9 GPixels/s, and Texture Fillrate comes in at 302.3 GTexel/s. Specs are great, but we care more about actual performance.
Let us move on and start our testing with computing-related benchmarks.
NVIDIA GeForce RTX 2060 Super Compute Related Benchmarks
As we progress with our GPU testing we felt it was time to clean up our charts. We dropped the Silent and OC results for each card and kept the fresh out of box numbers. Doing so made our graphs much easier to read, many users here at STH do not run cards in those configurations or simply cannot do so in Linux based systems so this was warranted. We still have our test numbers and might revisit those settings later on. This is something STH has simply outgrown.
Geekbench 4
Geekbench 4 measures the compute performance of your GPU using image processing to computer vision to number crunching.
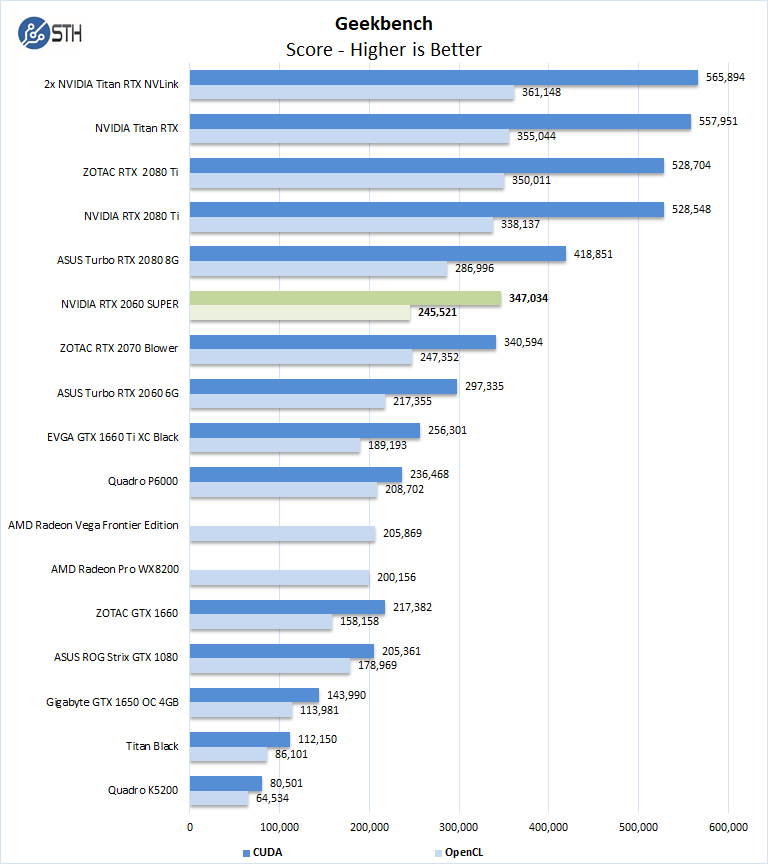
Our first compute benchmark we see the NVIDIA GeForce RTX 2060 Super 8GB card are in a virtual dead heat with the ZOTAC GeForce RTX 2070 Blower. A key theme in our review is that NVIDIA has increased performance at a given price point by an increment. As such, we expect to see results close to the original GeForce RTX 2070 8GB cards.
LuxMark
LuxMark is an OpenCL benchmark tool based on LuxRender.
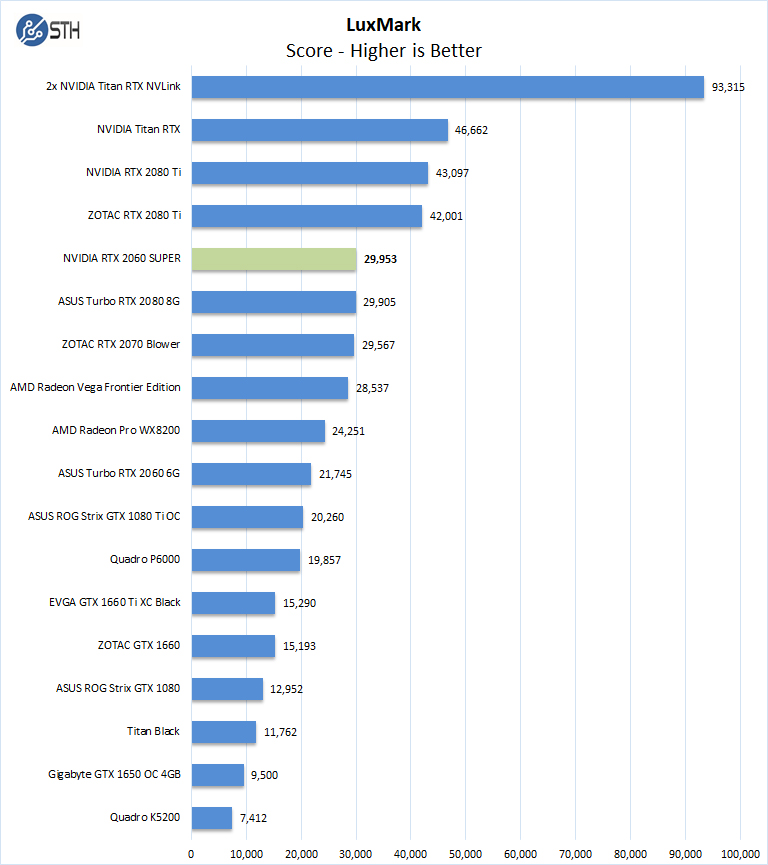
With Luxmark results, we find the NVIDIA GeForce RTX 2060 SUPER just passing the ASUS Turbo RTX 2080 8G which is a Blower style card. Better cooling on the NVIDIA GeForce RTX 2060 Super and the bump to 8GB of faster memory seem to yield better results.
AIDA64 GPGPU
These benchmarks are designed to measure GPGPU computing performance via different OpenCL workloads.
- Single-Precision FLOPS: Measures the classic MAD (Multiply-Addition) performance of the GPU, otherwise known as FLOPS (Floating-Point Operations Per Second), with single-precision (32-bit, “float”) floating-point data.
- Double-Precision FLOPS: Measures the classic MAD (Multiply-Addition) performance of the GPU, otherwise known as FLOPS (Floating-Point Operations Per Second), with double-precision (64-bit, “double”) floating-point data.
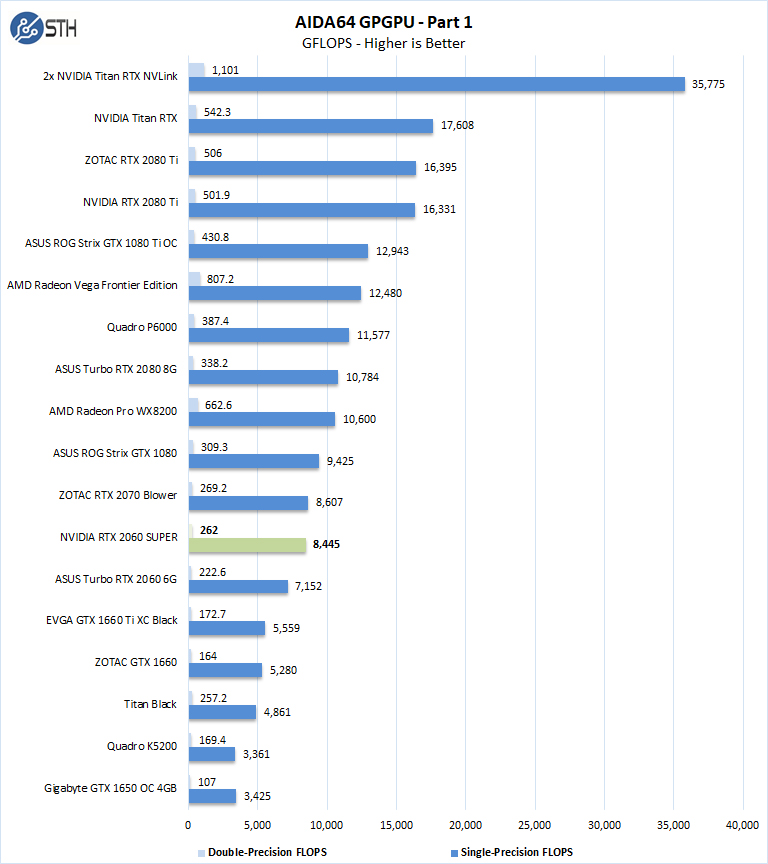
Here you can see substantially higher results, although not quite at the GeForce RTX 2070 levels.
The next set of benchmarks from AIDA64 are:
- 24-bit Integer IOPS: Measures the classic MAD (Multiply-Addition) performance of the GPU, otherwise known as IOPS (Integer Operations Per Second), with 24-bit integer (“int24”) data. This particular data type defined in OpenCL on the basis that many GPUs are capable of executing int24 operations via their floating-point units.
- 32-bit Integer IOPS: Measures the classic MAD (Multiply-Addition) performance of the GPU, otherwise known as IOPS (Integer Operations Per Second), with 32-bit integer (“int”) data.
- 64-bit Integer IOPS: Measures the classic MAD (Multiply-Addition) performance of the GPU, otherwise known as IOPS (Integer Operations Per Second), with 64-bit integer (“long”) data. Most GPUs do not have dedicated execution resources for 64-bit integer operations, so instead, they emulate the 64-bit integer operations via existing 32-bit integer execution units.
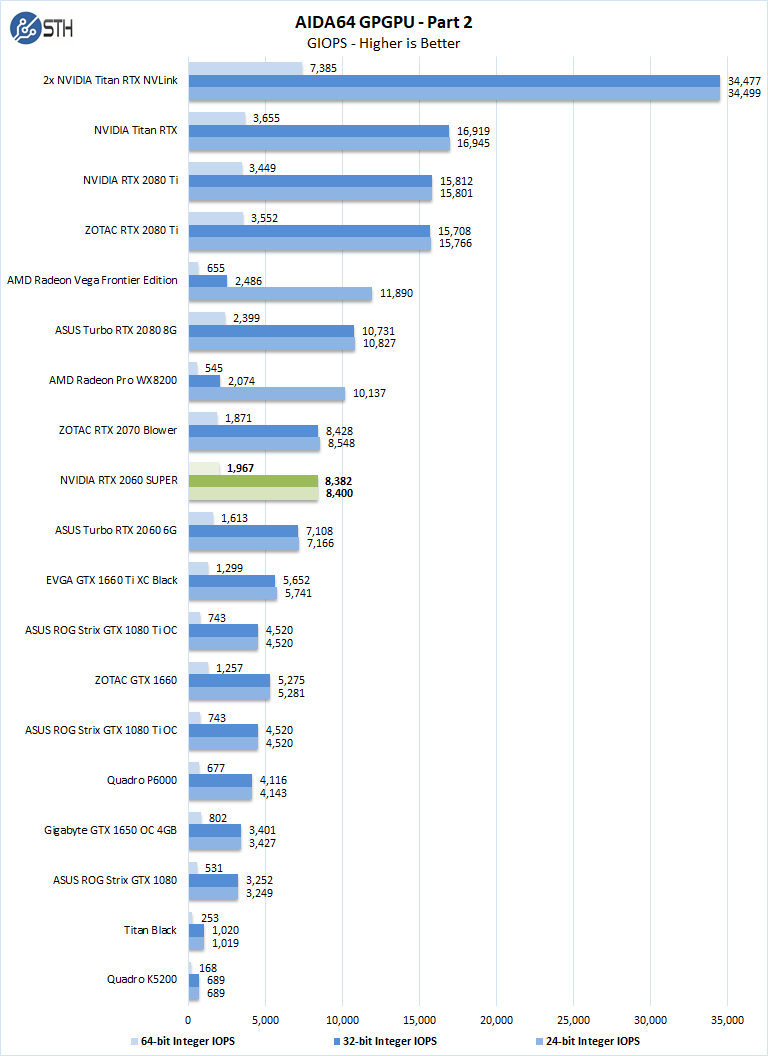
Again, the NVIDIA GeForce RTX 2060 Super performs fairly close to the GeForce RTX 2070.
hashcat64
hashcat64 is a password cracking benchmark that can run an impressive number of different algorithms. We used the Windows version and a simple command of hashcat64 -b. Out of these results we used five results to the graph. Users who are interested in hashcat can find the download here.
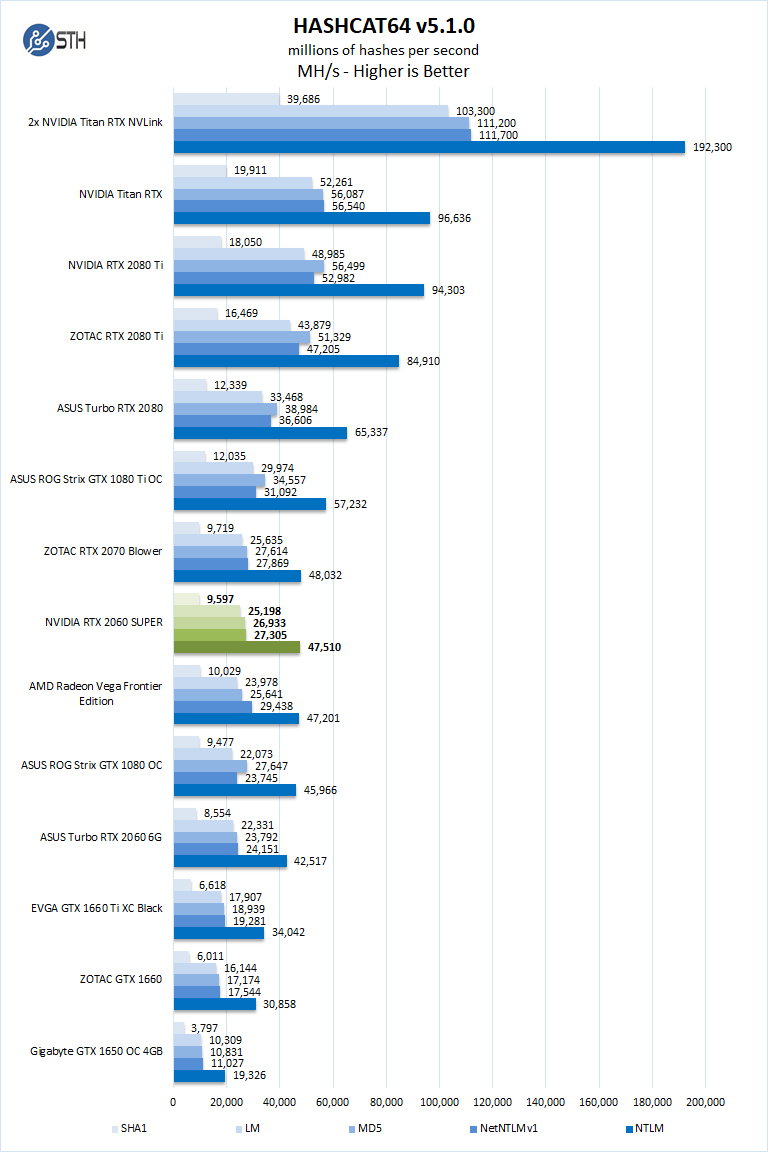
Hashcat64 is a demanding benchmark which heats up GPUs, here we see the NVIDIA GeForce RTX 2060 Super come in just between the GeForce RTX 2070 and the AMD Radeon Vega Frontier Edition card. In the past, AMD held a significant lead in these benchmarks, but that changes in this generation.
SPECviewperf 13
SPECviewperf 13 measures the 3D graphics performance of systems running under the OpenGL and DirectX application programming interfaces.
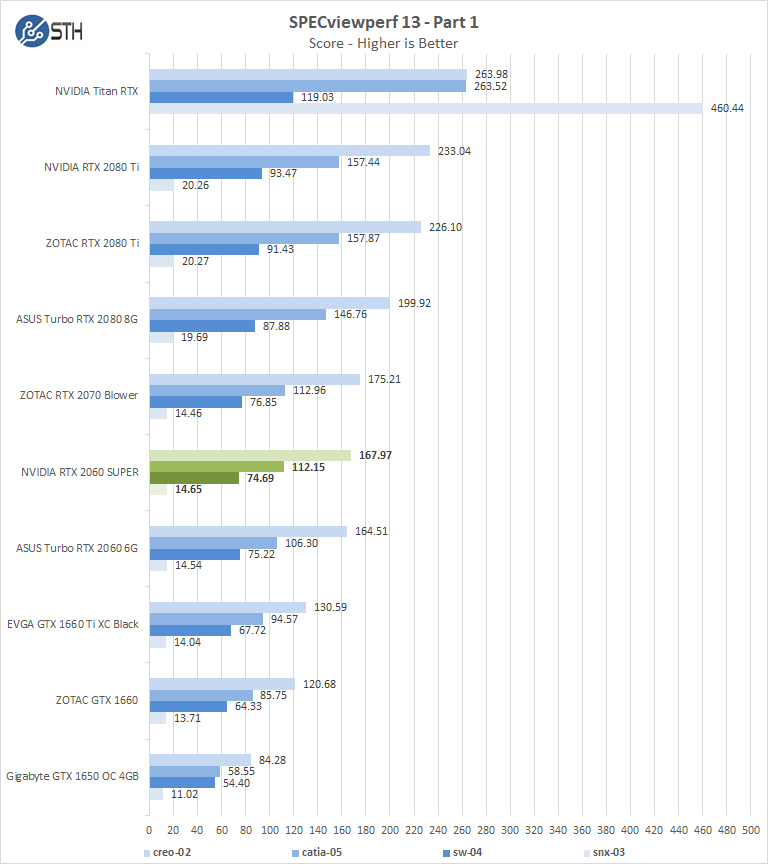
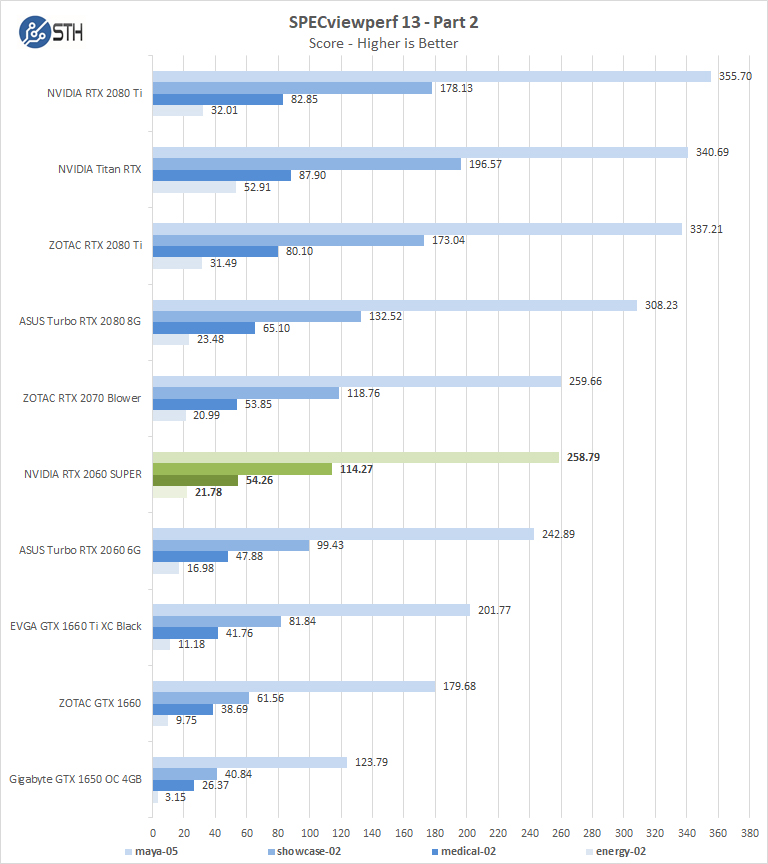
We again are going to simply note the pattern we have been seeing for multiple tests at this point.
Let us next move onto our rendering-related benchmarks.


Look at that TensorFlow training performance on pg. 5! That’s an insane upgrade over the Rtx 2060 6G. The Titan Rtxs change the chart’s scale but it’s a huge increase at the low end
Are you sure about this “Peak FP32 Compute: 14.2 TFLOPS”?
“A key reason that we started this series was to answer the cooling question.”
If the answer to this is your statement about running equal to other cards, that would not seem to be either a strong endorsement nor conclusive.
Hence I’m curious if it’d be possible to compare the 2060 Super vs. 2070 Blower. From your statement of test setup it appears the chart is single GPU, so perhaps multi-GPU would be closer to real-world. [yeah I know, ‘you guys should go buy 4 of those, a couple of these, some Titans …” etc., and I’ve spent $60k of your money that you don’t have 8]
Remember to use some beefy case fans, or just state what’s being used.
This review was very important to me, ended up demonstrating that the RTX 2060 SUPER is the true entry-level GPU for Machine Learning and Deep Learning. I have the following questions:
Which manufacturer has the best quality plate, greater durability, greater strength to work for long time under full load?
Is it possible to downclock this GPU by reducing its frequency? This is important in ML / DL processing that can last for days under full load, so the GPU does not constantly work overloaded, thereby increasing its lifespan and running the processing with more stability.
Workstation motherboards, in case you have two video cards or an offboard video card and the integrated video processor, such as ASUS Pro WS X570-ACE, ASUS WS C246 PRO, Gigabyte C246-WU4, have in their bios some kind of control in which can I set a card for video driver and another GPU to leave only for ML / DL processing?
Congratulations on the matter. I hope to briefly review the RTX 2070 SUPER.
Why wasnt Vega VII tested in this group?????
@asH
It’s only tested in benchmarks where NVidia is faster, just remember how STH earns their money.
I would love to know how we earn money @Misha? Sure is not from the STH publishing side for the last 10 years. Enlighten me. Seems like you know better than I do given the tone of that comment.
@asH very simple reason. We do not have one to test. If we did, it would be in there.
” ..very simple reason. We do not have one to test. If we did, it would be in there.”
-Then why wasnt that said that in the article?
Wait! Are you then saying you ONLY test cards given to you by manufacturers??
“On the AMD side, the new Navi based parts are unable to complete even half of our test suite due to the compute stack. ”
…Then this statement is a half truth because on the AMD side their compute card, Vega VII (based in MI50/60), the 7nm(25%) big brother to Frontier wasnt tested because you didnt have one. ..Quite an impressive array of cards you did have. Just sayin’
asH asH we tend to present the relevant data we have. For example, when we review a Xeon-based server we usually test with multiple SKUs. We do not test with all 50+ SKUs because it would take too long and we do not have every Xeon SKU.
We buy cards to test from time-to-time. On the other hand, we knew the Radeon VII would have a *very* short lifespan in the market. Given the price tag, our budgets, and expected traffic from a Radeon VII review, we could not buy one. Radeon VII was a very short-lived product.
On the Navi statement, that was based on AMD’s acknowledgment as well that their compute drivers for those cards were not ready yet. No half-truth there.
If you would like to provide a Radeon VII, we are happy to test it just to add to the database. My sense is that you just want to see the now discountinued Radeon VII in these charts.
I am surprised by the low DP FLOPS (FP64) performance for all of these. I know old GPUs had no or hardly any FP64 (like 1:24) but I thought newer cards had ratios like 1:3, or configurable allocations between FP32 and FP64, allowing up to 1:3 ratios. Is there some background to the testing that would clarify this, or are the advertised improvements in FP64 performance just hype?
Dear all,
I am really impressed with the benchmarks and your proffesionalism.
Please do share how to achieve such a high result (6990) in superposition, would really like to know that, or at least to come somewhat close to that (currently breached the 6000 limit).
Thank you in advance.
how could you reach 6990 points in superposition with the rtx 2060 super?
somebody…!
Jason – William just adds what he gets from the output using the test configuration he has. If you have a different configuration, you will likely get something different. We do not have the resources to troubleshoot everyone’s specific configuration.
that is not a 2060 super you are testing. look at your gpu z. the actual gpu and the texture fill rate is off.
and your TMUs