AIDA64 Memory Test
AIDA64 memory bandwidth benchmarks (Memory Read, Memory Write, and Memory Copy) measure the maximum achievable memory data transfer bandwidth.
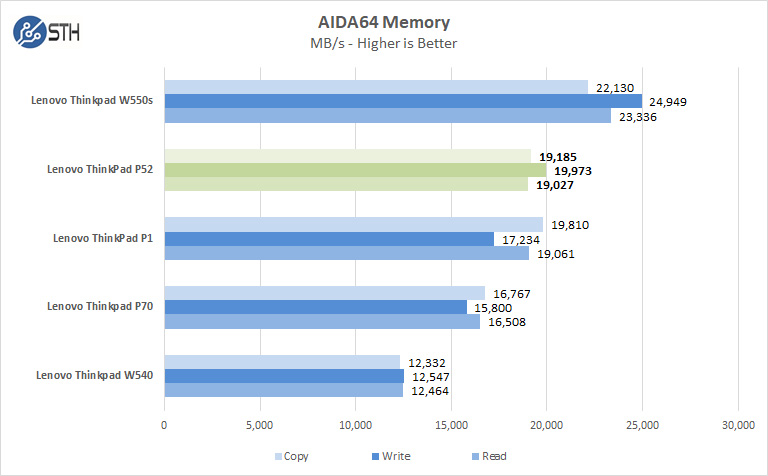
Our Lenovo ThinkPad P52 has only one stick of memory installed. Installing additional memory sticks in the ThinkPad P52 would provide us with higher results that we see here. Although it increases power consumption and therefore decreases battery life, populating a second SODIMM can double memory performance.
AIDA64 GPGPU
These benchmarks are designed to measure GPGPU computing performance via different OpenCL workloads.
- Single-Precision FLOPS: Measures the classic MAD (Multiply-Addition) performance of the GPU, otherwise known as FLOPS (Floating-Point Operations Per Second), with single-precision (32-bit, “float”) floating-point data.
- Double-Precision FLOPS: Measures the classic MAD (Multiply-Addition) performance of the GPU, otherwise known as FLOPS (Floating-Point Operations Per Second), with double-precision (64-bit, “double”) floating-point data.
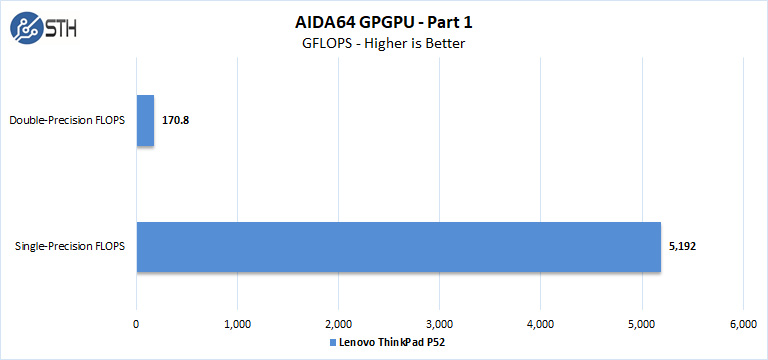
These are solid numbers that we will discuss after the next section.
The next set of benchmarks from AIDA64 are:
- 24-bit Integer IOPS: Measures the classic MAD (Multiply-Addition) performance of the GPU, otherwise known as IOPS (Integer Operations Per Second), with 24-bit integer (“int24”) data. This particular data type defined in OpenCL on the basis that many GPUs are capable of executing int24 operations via their floating-point units.
- 32-bit Integer IOPS: Measures the classic MAD (Multiply-Addition) performance of the GPU, otherwise known as IOPS (Integer Operations Per Second), with 32-bit integer (“int”) data.
- 64-bit Integer IOPS: Measures the classic MAD (Multiply-Addition) performance of the GPU, otherwise known as IOPS (Integer Operations Per Second), with 64-bit integer (“long”) data. Most GPUs do not have dedicated execution resources for 64-bit integer operations, so instead, they emulate the 64-bit integer operations via existing 32-bit integer execution units.
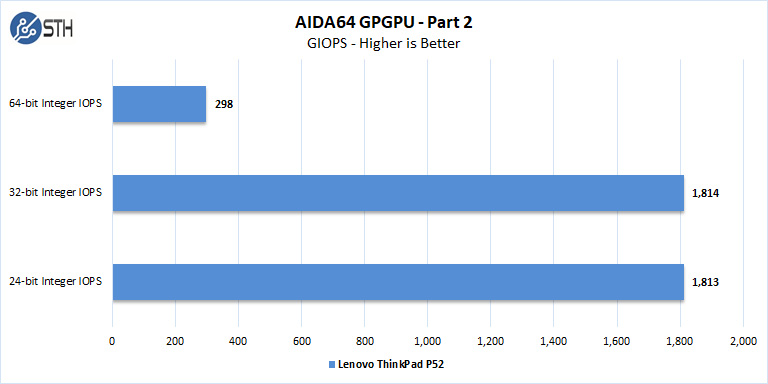
The Nvidia Quadro P3200 6GB results translate to approximately GTX 1660 performance levels. If you want a comparison to common desktop workstation GPUs, you can see comparison data in our recent EVGA GeForce GTX 1660 Ti XC Black Review.
Cinebench R15
CINEBENCH is a real-world cross platform test suite that evaluates your computer’s performance capabilities. The test scenario uses all of your system’s processing power to render a photorealistic 3D scene. This scene makes use of various algorithms to stress all available processor cores. You can also run this test with a single core mode to give a single core rating.
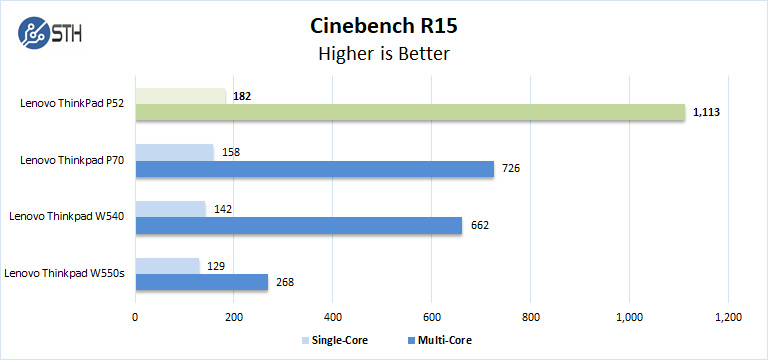
In Cinebench R15 the Core i7-8850H shows improvements over previous generation units we have reviewed. We were certainly surprised to see the degree of improvement here.
Geekbench 4
Geekbench 4 measures the compute performance of your GPU using image processing to computer vision to number crunching.
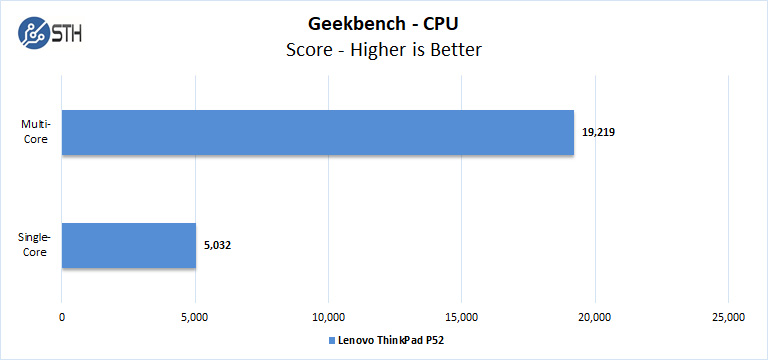
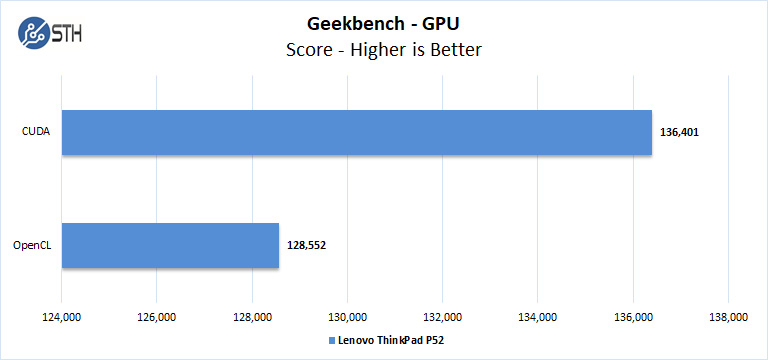
Overall the P52 shows solid results. Again, you can compare these results to a broader set of desktop results in our NVIDIA Titan RTX Review.
LuxMark
LuxMark is an OpenCL benchmark tool based on LuxRender.
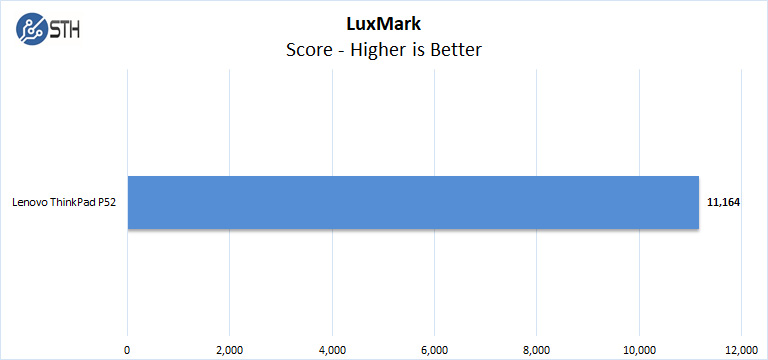
In LuxMark, we see performance closer to an NVIDIA Titan Black levels. The NVIDIA Titan Black is a five-year-old 250W video card. It is amazing to see how the process and architectural improvements have brought that level of performance down to mobile.
Let us move on and start our testing with graphics-related benchmarks.

