Kioxia FL6 800GB Basic Performance
For this, we are going to run through a number of workloads just to see how the Kioxia FL6 performs. We would also like to provide some easy screenshots of the desktop tool so you can see the results quickly and easily compared to other drives you may have.
CrystalDiskMark 8.0.4 x64
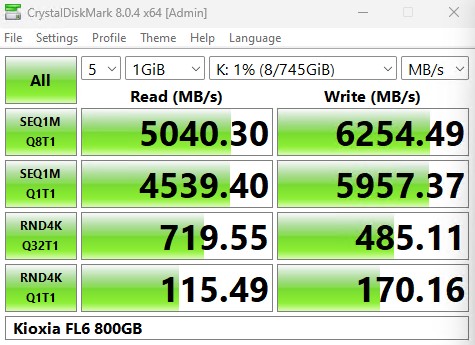
CrystalDiskMark is used as a basic starting point for benchmarks as it is something commonly run by end-users as a sanity check. Here is the smaller 1GB test size:
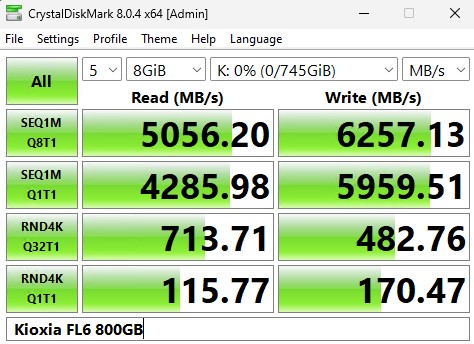
Here is the larger 8GB test size:
In the event you want to see a side-by-side, here they are:
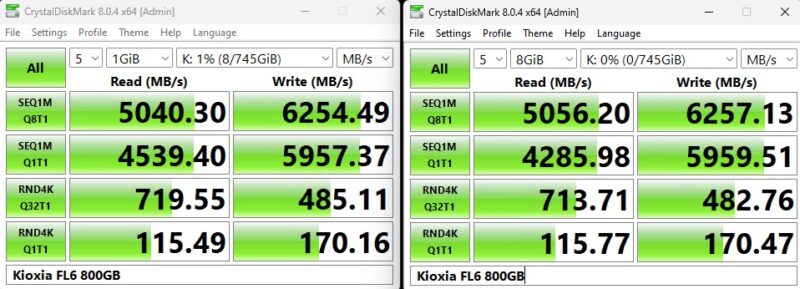
Although the 4K Random read Q32T1 numbers were higher than the write at that queue depth, the rest of the metrics favored the write column. That is exactly the point of a write focused drive, but also exactly opposite what we see from the majority of drives that are designed for read workloads.
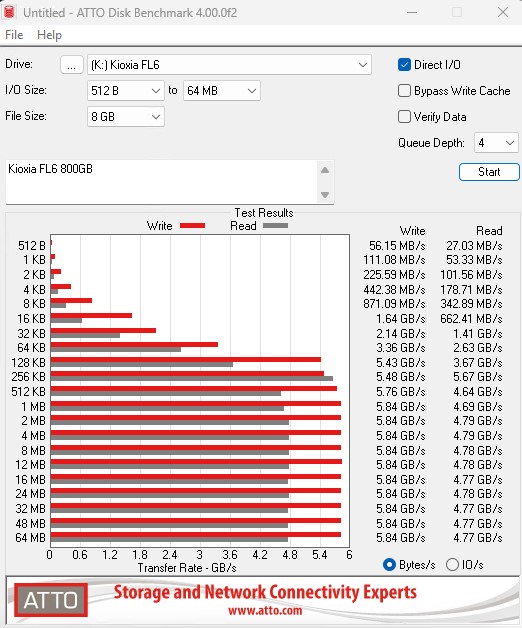
ATTO Disk Benchmark
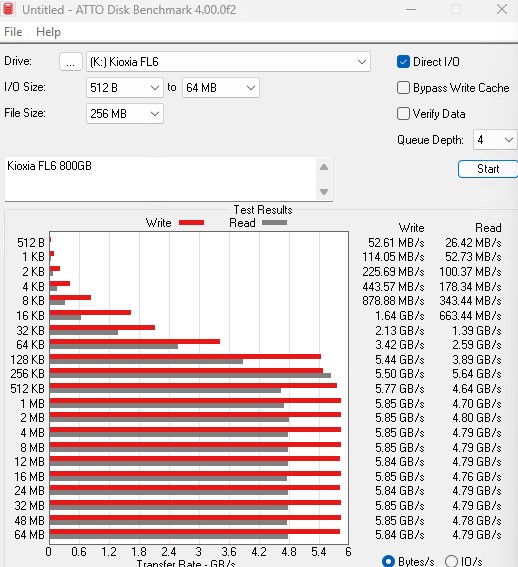
The ATTO Disk Benchmark has been a staple of drive sequential performance testing for years. ATTO was tested at both 256MB and 8GB file sizes.
Here is the 8GB result:
For those who want to see the results compared side-by-side:
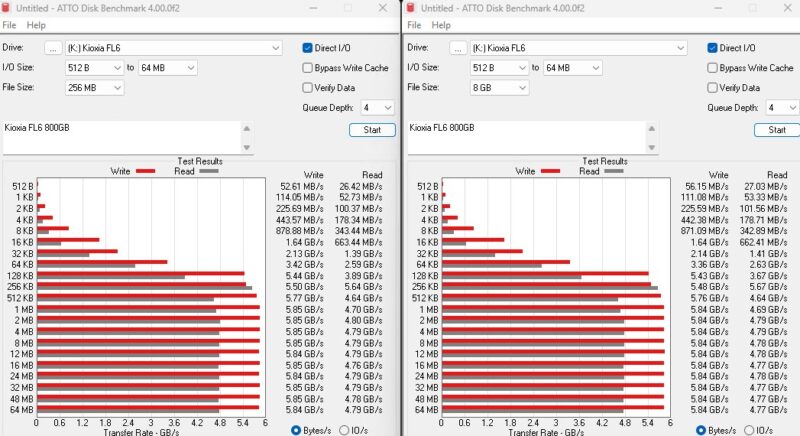
Again, the drive performs exceptionally well in the write column compared to the read, except at 256KB. That 256KB feels like a drive configuration quirk or a specific optimization given that it is out of line with other figures. We purchased more than one drive, and they all exhibited this behavior.
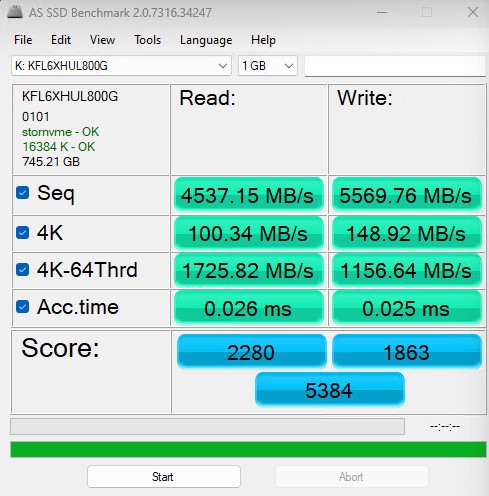
AS SSD Benchmark
AS SSD Benchmark is another good benchmark for testing SSDs. We run all three tests for our series. Like other utilities, it was run with both the default 1GB as well as a larger 10GB test set.
Here is the 10GB test size:
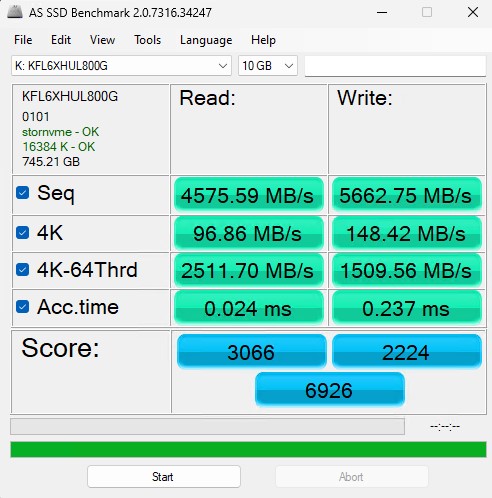
Again, here is the side-by-side.
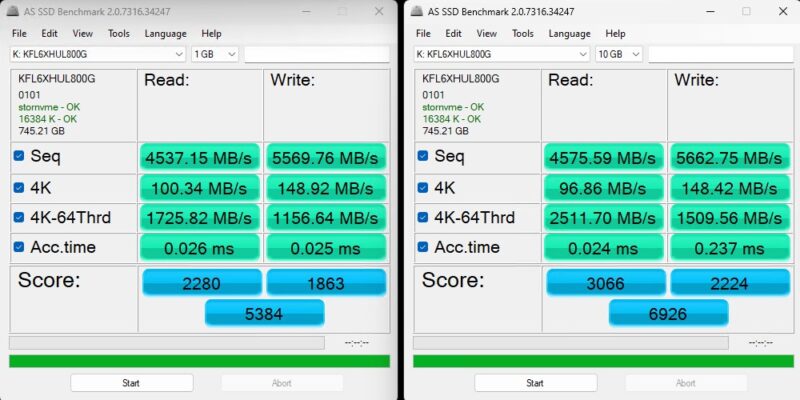
Again, at higher queue depth random 4K workloads, the read score is better, but otherwise, the write scores are higher.
Next, let us get into some of our Linux-based benchmarking.
Kioxia FL6 Four Corners Performance
Our first test was to see sequential transfer rates and 4K random IOPS performance for the Kioxia FL6. Please excuse the smaller-than-normal comparison set. In the next section, you will see why we have a reduced set. The main reason is that we swapped to a multi-architectural test lab. We test these in more than 20 different processor architectures spanning PCIe Gen4 and Gen5. Still, we wanted to take a look at the performance of the drives.
Here is the 4K random read-and-write performance:
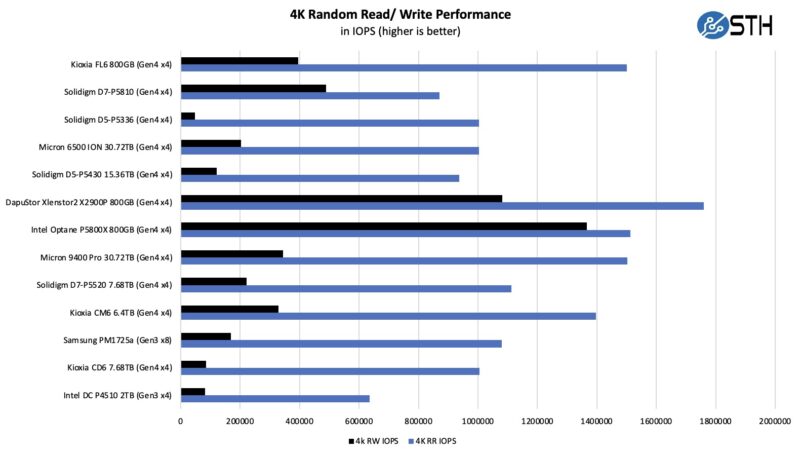
On the longer test runs, the 4K Random Read figures really pick up. Kioxia’s solution can out-pace Solidigm’s here by a notable margin. At the same time, the DapuStor Xlenstor2 X2900P, which also uses Kioxia’s XL-FLASH, is a beast.
Kioxia FL6 Application Performance Comparison
For our application testing performance, we are still using AMD EPYC. We have all of these working on x86 but we do not have all working on Arm and POWER9 yet so this is still an x86 workload.
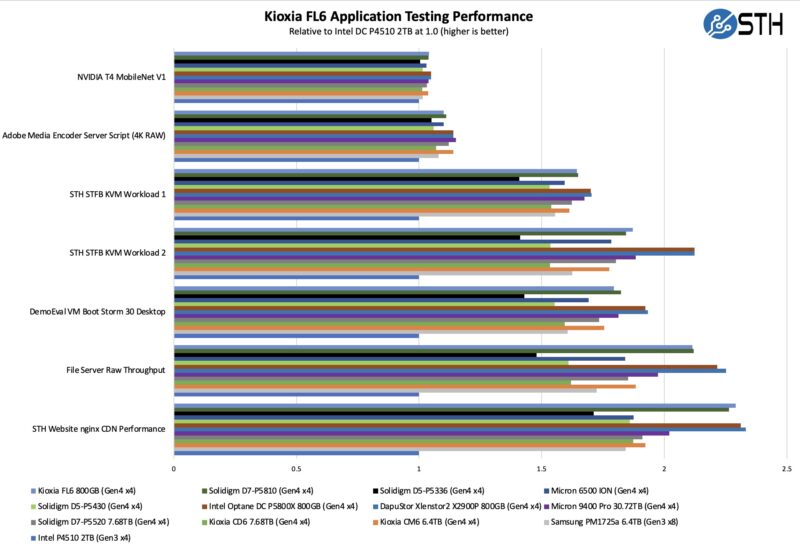
As you can see, there are a lot of variabilities here in terms of how much impact the Kioxia FL6 has on application performance. Let us go through and discuss the performance drivers.
On the NVIDIA T4 MobileNet V1 script, we see very little performance impact on the AI workload, but we see some. The key here is that the performance of the NVIDIA T4 mostly limits us, and storage is not the bottleneck. We have a NVIDIA L4 that we are going to use with an updated model in the future. Here we can see a benefit to the newer drives in terms of performance, but it is not huge. That is part of the overall story. Most reviews of storage products are focused mostly on lines, and it may be exciting to see sequential throughput double in PCIe Gen3 to PCIe Gen4, but in many real workloads, the stress of a system is not solely in the storage.
Likewise, our Adobe Media Encoder script is timing copy to the drive, then the transcoding of the video file, followed by the transfer off of the drive. Here, we have a bigger impact because we have some larger sequential reads/ writes involved, the primary performance driver is the encoding speed. The key takeaway from these tests is that if you are mostly compute-limited but still need to go to storage for some parts of a workflow, the SSD can make a difference in the end-to-end workflow.
On the KVM virtualization testing, we see heavier reliance upon storage. The first KVM virtualization, Workload 1, is more CPU-limited than Workload 2 or the VM Boot Storm workload, so we see strong performance, albeit not as much as the other two. These are KVM virtualization-based workloads where our client is testing how many VMs it can have online at a given time while completing work under the target SLA. Each VM is a self-contained worker. We know, based on our performance profiling, that Workload 2, due to the databases being used, actually scales better with fast storage and Optane PMem. At the same time, if the dataset is larger, PMem does not have the capacity to scale, and it is being discontinued as a technology. This profiling is also why we use Workload 1 in our CPU reviews. Kioxia’s random IOPS performance is really helping here. On Workload 2, and the VM Boot Storm, we see the performance of the drives is very good.
Moving to the file server and nginx CDN, we see much solid QoS and throughput from the Kioxia SSD. The drive pulls ahead on the file server due to its faster sequential speeds. On the nginx CDN test, we are using an old snapshot and access patterns from the STH website, with caching disabled, to show what the performance looks like in that case. Here is a quick look at the distribution:
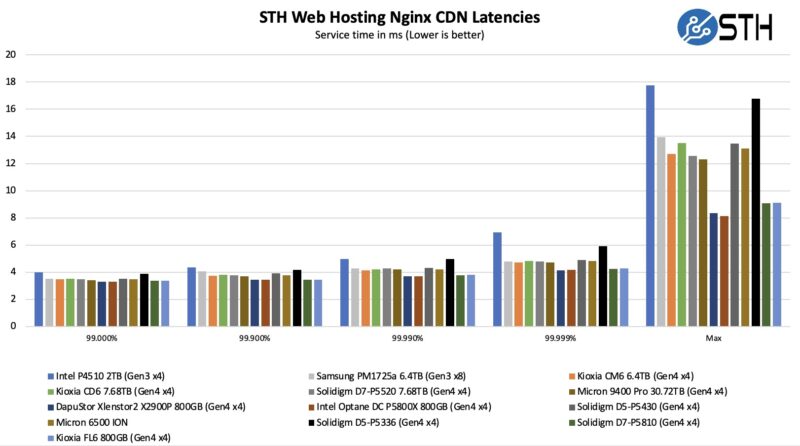
Here is where we can really see the big delta between a SCM-class device and a capacity-focused SSD. The gap is not overly present at the 99% interval. By the time we hit five-9’s the gap is huge. The Kioxia FL6 belongs in a class of better performing drives on this test.
Now, for the big project: we tested these drives using every PCIe Gen4 architecture and all the new PCIe Gen5 architectures we could find, and not just x86, nor even just servers that are available in the US.


I wonder how much actual NAND they have inside, as it would be nice to see how it’s split up between the useable and the spare area.
I’d say 1 TiB = 1.1 TB, but that’s pure guess. That would be your standard “write-intensive” 27% spare, but given it’s SLC, this might be enough to do 60 DWPD.
Anyhow, this is an important piece of information I’d also like to see mentioned in the review (in *all* SSD reviews, actually): actual NAND capacity and number of packages.
@Robert & @G., TechPowerUp says:
Name: BiCS4 XL-Flash
Part Number: TH58LJT0SA4BA8H
Type: SLC
Technology: 96-layer
Speed: 800 MT/s
Capacity: 8 chips @ 1 Tbit
Topology: Charge Trap
Die Size: 96 mm² (1.3 Gbit/mm²)
Dies per Chip: 8 dies @ 128 Gbit
Planes per Die: 16
Decks per Die: 1
In any case, this is a crucial piece of information that should be included in the review (and, honestly, in all SSD reviews): the actual NAND capacity and the number of packages.
Your blog is a goldmine of valuable insights! The structured approach, clarity in writing, and well-researched content make it an excellent resource. I truly appreciate the effort you put into every post. Keep up the fantastic work! I always look forward to more of your engaging and informative content. Thanks for sharing such high-quality knowledge!