Intel Xeon W-1270 Benchmarks
For this exercise, we are using our legacy Linux-Bench scripts which help us see cross-platform “least common denominator” results we have been using for years as well as several results from our updated Linux-Bench2 scripts. At this point, our benchmarking sessions take days to run and we are generating well over a thousand data points. We are also running workloads for software companies that want to see how their software works on the latest hardware. As a result, this is a small sample of the data we are collecting and can share publicly. Our position is always that we are happy to provide some free data but we also have services to let companies run their own workloads in our lab, such as with our DemoEval service. What we do provide is an extremely controlled environment where we know every step is exactly the same and each run is done in a real-world data center, not a test bench.
We are going to show off a few results and highlight several interesting data points in this article.
Python Linux 4.4.2 Kernel Compile Benchmark
This is one of the most requested benchmarks for STH over the past few years. The task was simple, we have a standard configuration file, the Linux 4.4.2 kernel from kernel.org, and make the standard auto-generated configuration utilizing every thread in the system. We are expressing results in terms of compiles per hour to make the results easier to read:
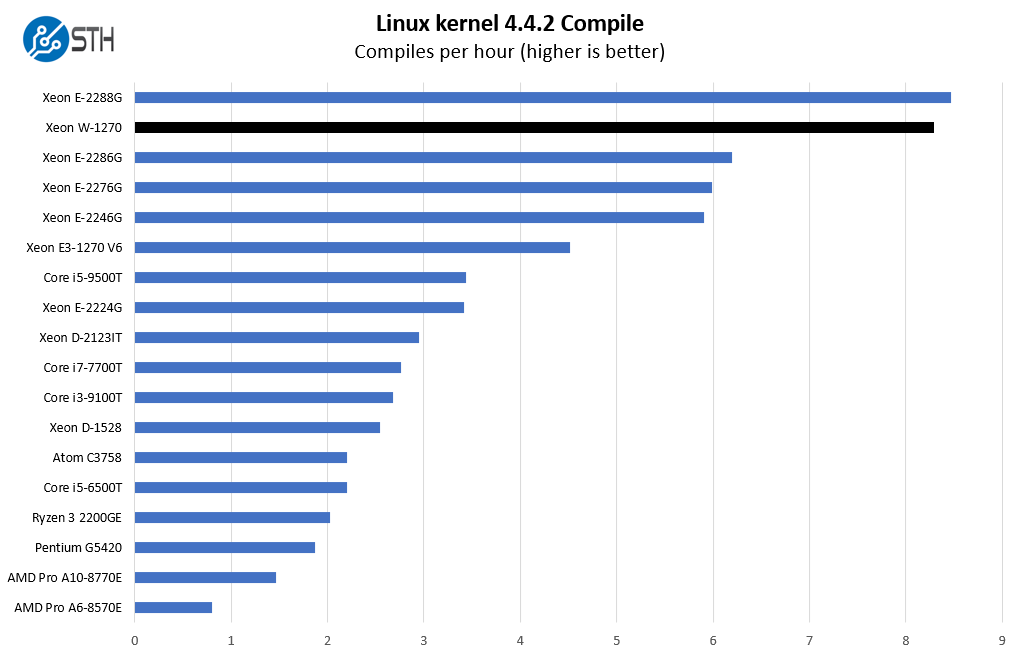
We are going to show a few comparison viewpoints with this series. Specifically, we wanted to focus on the Xeon E-2200 series and the higher 6 and 8 core offerings in that series. As one may expect, there are a lot of workloads that are dominated by having more cores. Here, we can see an almost step function of having six cores versus eight cores.
c-ray 1.1 Performance
We have been using c-ray for our performance testing for years now. It is a ray tracing benchmark that is extremely popular to show differences in processors under multi-threaded workloads. We are going to use our 8K results which work well at this end of the performance spectrum.
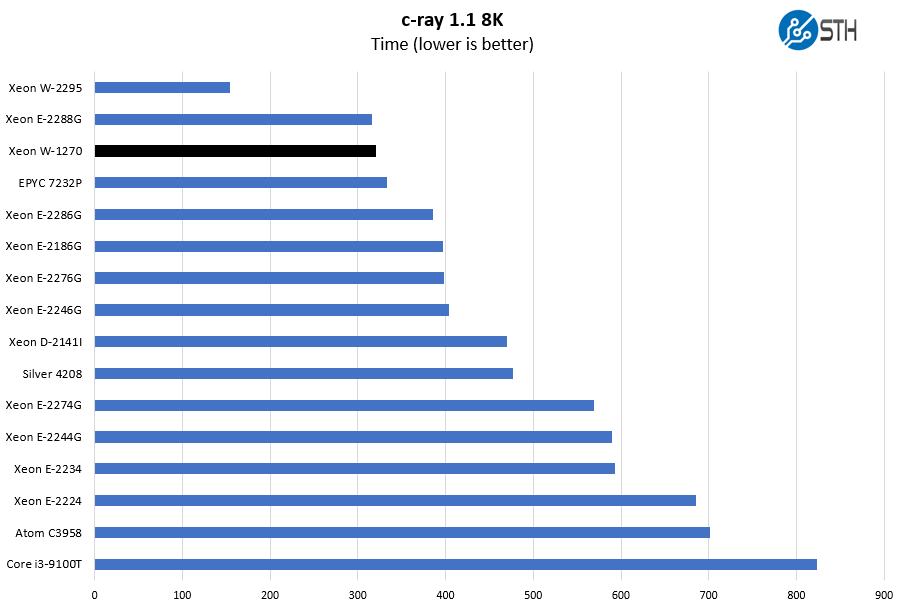
There are architectural differences that come into play on AMD v. Intel. In this example, despite the same core count as the AMD EPYC 7232P we would expect the W-1270 to be dramatically faster. Instead, the results are close. Typically, this is a test where AMD does better from an architect standpoint, so that can lead to covering the clock speed disparity.
7-zip Compression Performance
7-zip is a widely used compression/ decompression program that works cross-platform. We started using the program during our early days with Windows testing. It is now part of Linux-Bench.
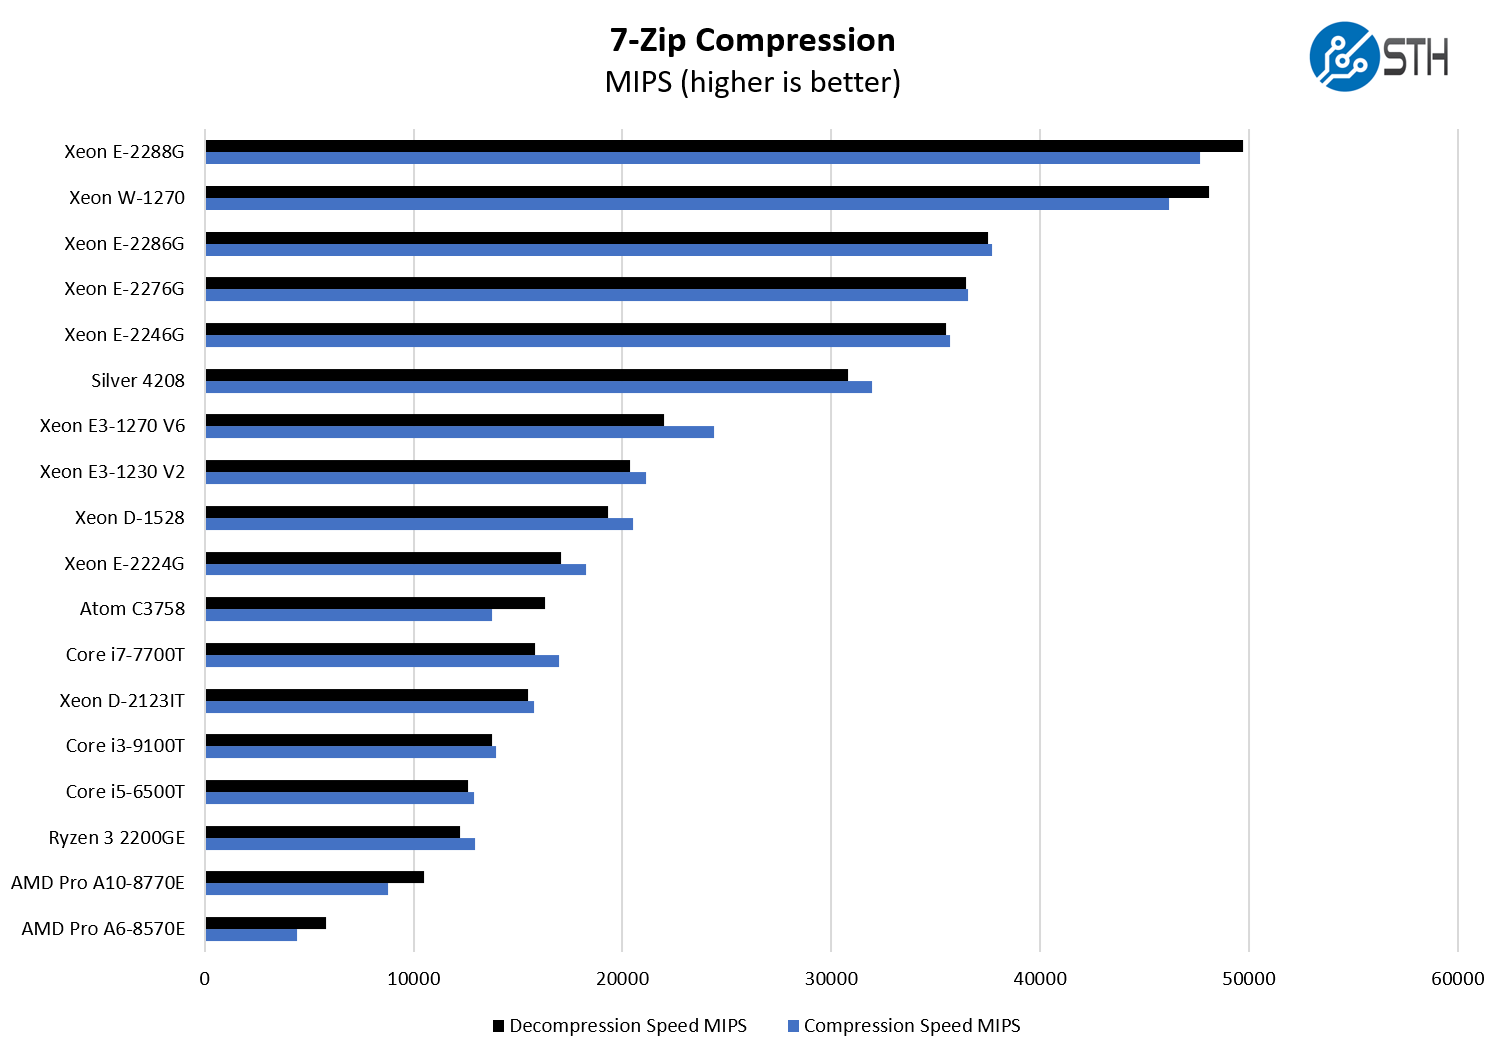
We are including some of the Intel Core “T” versions here. We simply wanted to show the difference between moving up from a 35W corporate desktop PC to a Xeon W-1270 for an employee’s workstation. Since we had many of these as part of our Project TinyMiniMicro series, we had quite a few data points from that segment. As you can see, the extra TDP headroom makes a big difference.
NAMD Performance
NAMD is a molecular modeling benchmark developed by the Theoretical and Computational Biophysics Group in the Beckman Institute for Advanced Science and Technology at the University of Illinois at Urbana-Champaign. More information on the benchmark can be found here. We are going to augment this with GROMACS in the next-generation Linux-Bench in the near future. With GROMACS we have been working hard to support Intel’s Skylake AVX-512 and AVX2 supporting AMD Zen architecture. Here are the comparison results for the legacy data set:
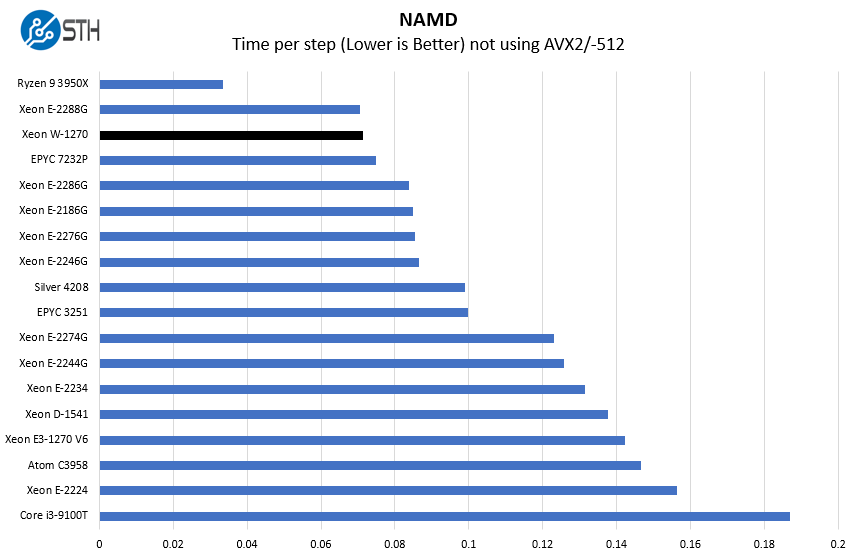
There are some companies, such as with the ASRock Rack X570D4I-2T that are trying to build Ryzen CPUs into competitive platforms for the Xeon W. As we can see, this can make a lot of sense given the Ryzen 9 3950X performance.
Sysbench CPU test
Sysbench is another one of those widely used Linux benchmarks. We specifically are using the CPU test, not the OLTP test that we use for some storage testing.
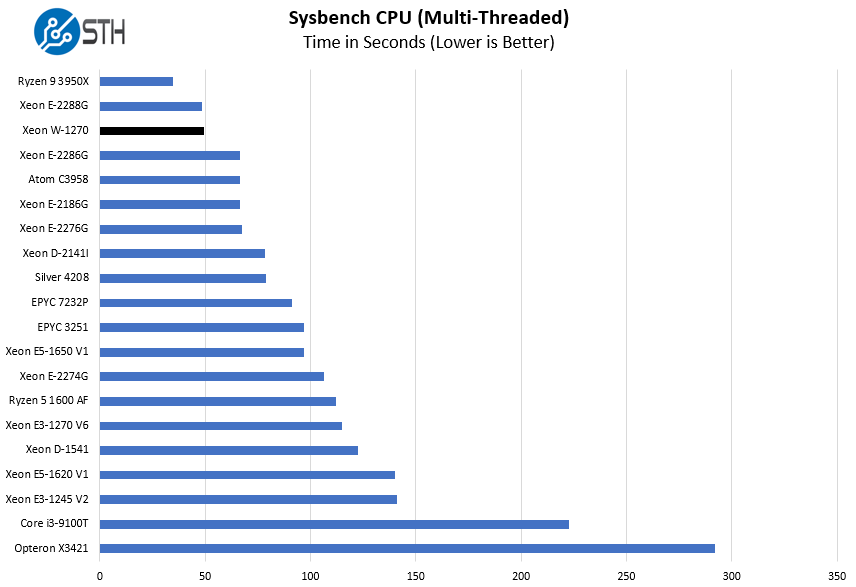
We also wanted to show some performance deltas compared to some legacy server/ workstation options. Specifically, we have the Xeon E3-1245 V2 and Xeon E5-1620 here to show just how much faster the new chips are. We are seeing close to a 3x improvement even if that is not equal to the core count delta. A lot of that is coming from clock speeds.
OpenSSL Performance
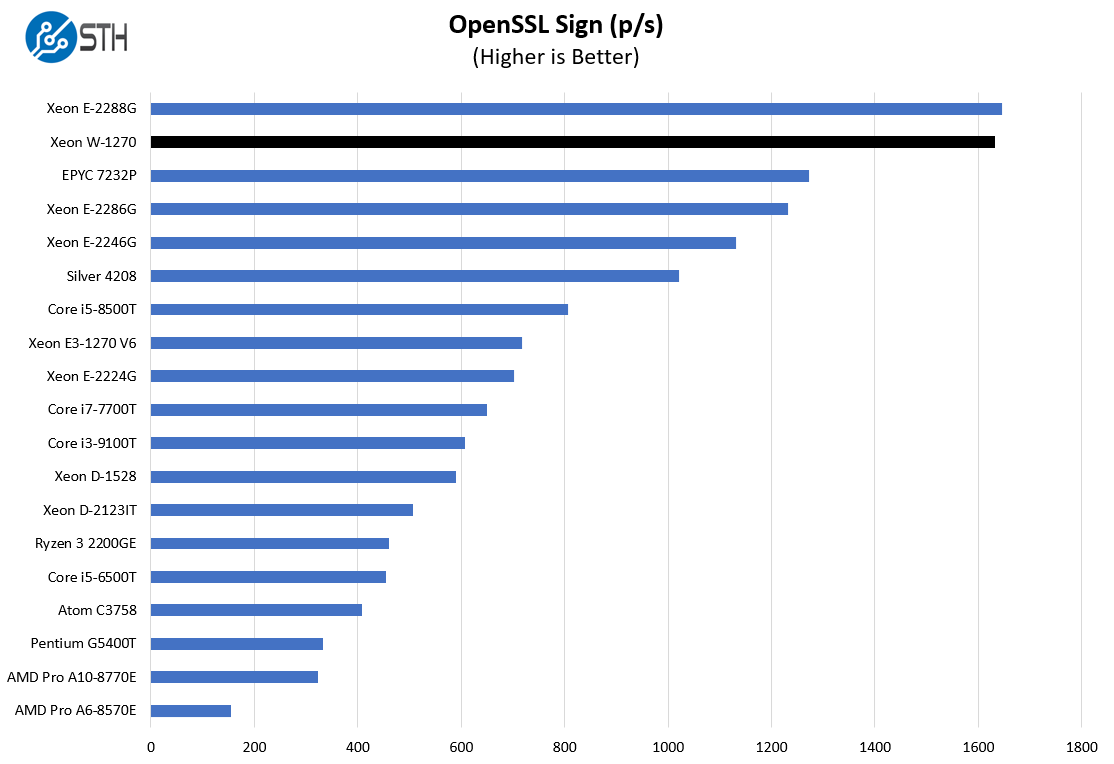
OpenSSL is widely used to secure communications between servers. This is an important protocol in many server stacks. We first look at our sign tests:
Here are the verify results:
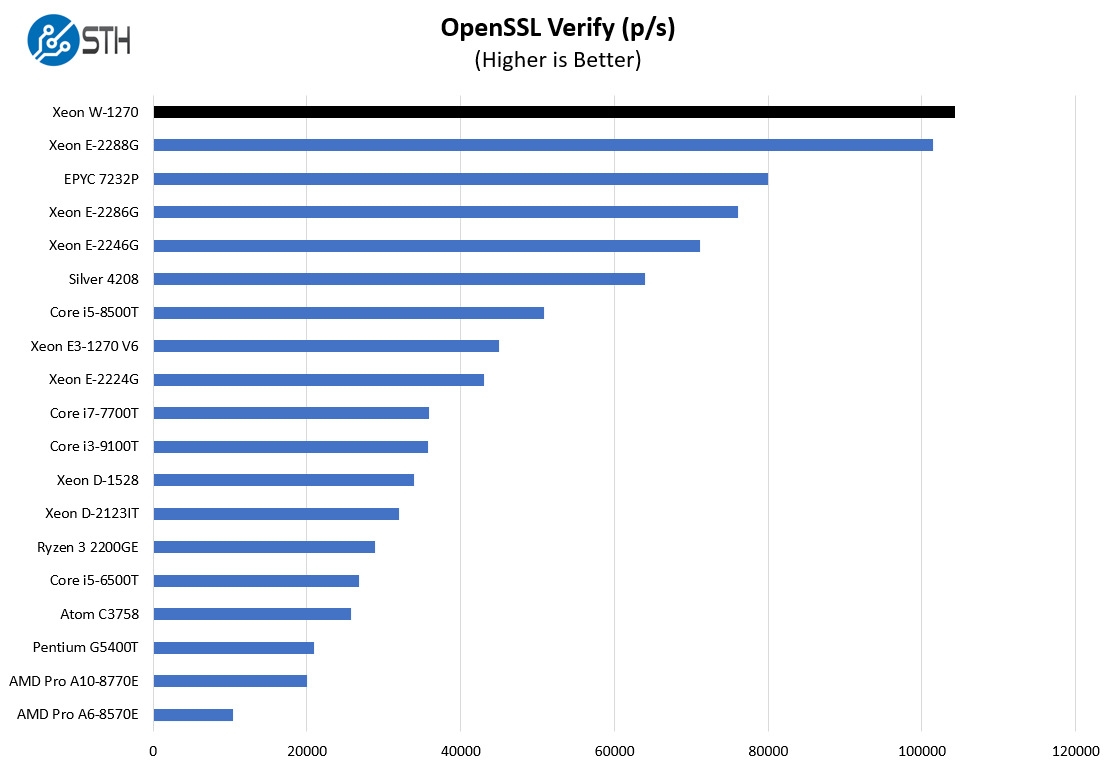
Here we saw a slightly unexpected result with the Xeon W-1270 trading places with the Intel Xeon E-2288G. Given the higher TDP headroom on the E-2288G, we would expect that chip to be faster. In virtually every case it is. The OpenSSL Sign tests followed that pattern. Conversely, the OpenSSL Verify tests did not.
UnixBench Dhrystone 2 and Whetstone Benchmarks
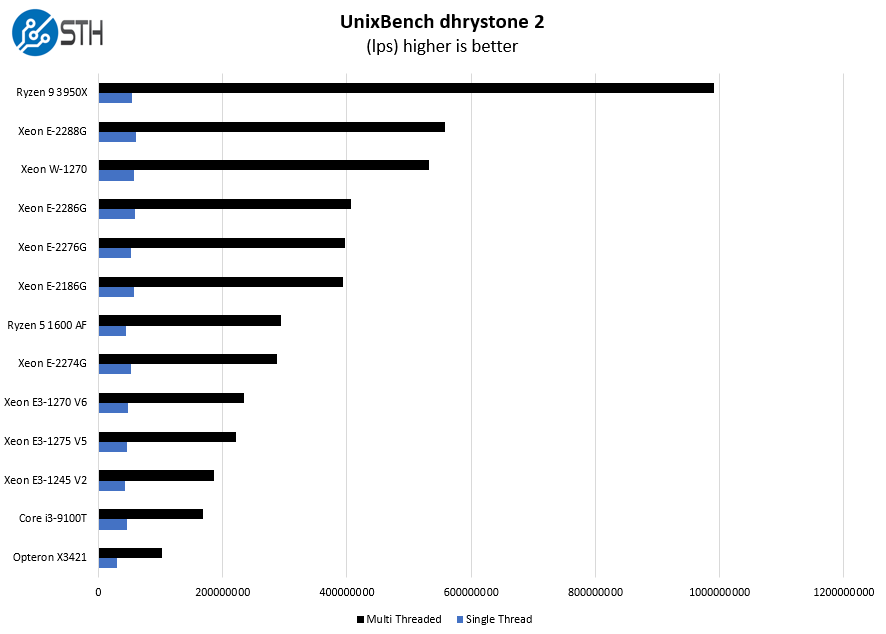
Some of the longest-running tests at STH are the venerable UnixBench 5.1.3 Dhrystone 2 and Whetstone results. They are certainly aging, however, we constantly get requests for them, and many angry notes when we leave them out. UnixBench is widely used so we are including it in this data set. Here are the Dhrystone 2 results:
Here are the whetstone results:
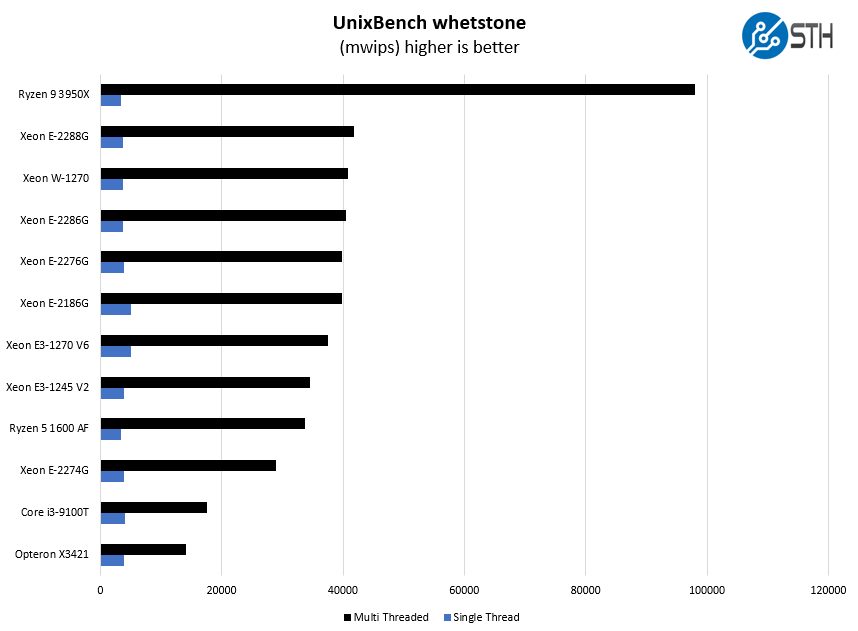
These charts can become complicated quickly, so we streamlined the results. Again, while the Intel Xeon W-1270 is fast for this segment of Intel processors, AMD has compelling performance in the segment as well, albeit without the integrated GPU. The AMD Ryzen 9 3950X is around twice the price at the component level, but it can offer around 2x the performance in some scenarios. In the context of an entire system of this class, doubling of the CPU price often means less than a 20% impact on total systems costs.
GROMACS STH Small AVX2/ AVX-512 Enabled
We have a small GROMACS molecule simulation we previewed in the first AMD EPYC 7601 Linux benchmarks piece. In Linux-Bench2 we are using a “small” test for single and dual-socket capable machines. Our medium test is more appropriate for higher-end dual and quad-socket machines. Our GROMACS test will use the AVX-512 and AVX2 extensions if available.
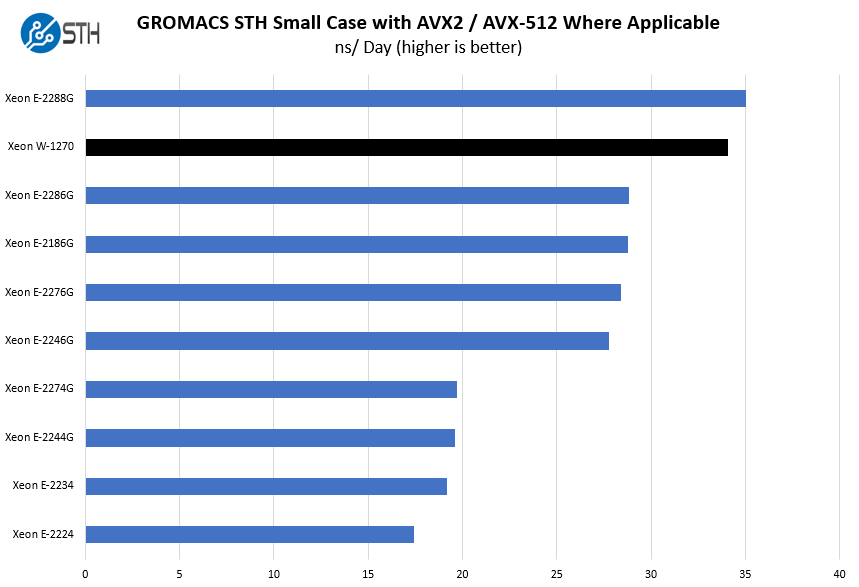
We are looking at the performance throughout the range. We found that the chips are being TDP limited. We are focusing on the previous two generations here and the results follow a pattern we have seen regularly.
Chess Benchmarking
Chess is an interesting use case since it has almost unlimited complexity. Over the years, we have received a number of requests to bring back chess benchmarking. We have been profiling systems and are ready to start sharing results:
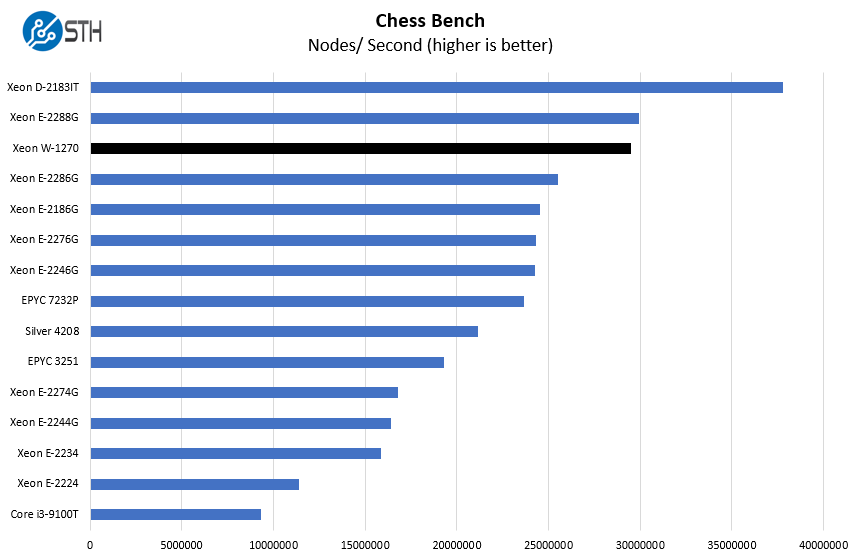
Before concluding this segment, we wanted to discuss the comparison to the Intel Xeon Silver 4208 which actually costs more than the Xeon W-1270 at list price. The Xeon Silver 4208 gets a bigger platform with more memory and PCIe lane support. The Xeon W-1270 adds the Intel P630 iGPU along with higher clock speeds and updated core design. For a workstation, the Xeon W-1270 is going to be significantly more responsive if one is not using the extended expansion options of the Xeon Silver 4208 line.
Next, we are going to have power consumption, market positioning, and our final words.



Graphical Screenshots of Terminalwindows is something for idiots.
Great performance review! Nicely done.
What would be interesting to see is the boost behavior compared to a 10700.
Wondering if the Xeons are more focused on high-load scenarios compared to their Core i7/i9 counterparts.
Why does this article compare w-1270 with e-2288g? Why ignore the e-2278g which has identical 3.4g base freq, identical 5.0 single core turbo, identical 14nm++++ and identical 80w tdp? What is the difference between these two seemingly identical chips? E-2288g at 95w isn’t really relevant here.
mostly the w1270 requires a new chipset and thus a new mainboard. which is a shame since it’s basically the same silicon as a e2278G…
How does the W-1270 compare to W-2245? I cannot see how/why W-2245 is superior.