Intel Core i9-10980XE Windows Performance
First, we are going to move through our Windows suite before we proceed to our Linux testing. Instead of focusing on lower-end mainstream products, we are going to focus on higher-end parts.
Intel Core i9-10980XE AIDA64 Memory Test
AIDA64 memory bandwidth benchmarks (Memory Read, Memory Write, and Memory Copy) measure the maximum achievable memory data transfer bandwidth.
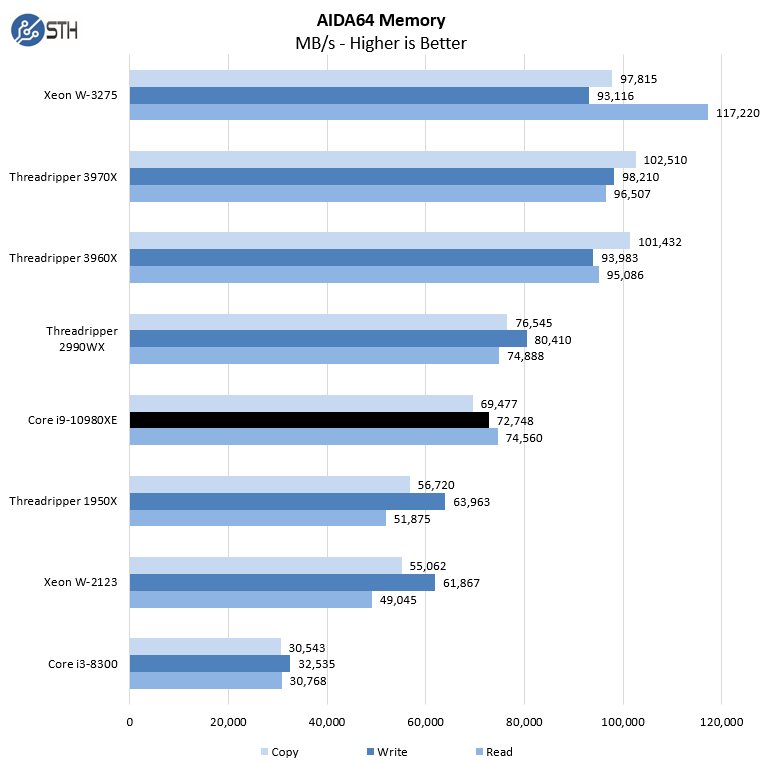
We have 4x 16GB DDR4-2933 DRAM sticks on our test platform which boosts memory read speeds a great deal. The EVGA X299 Dark motherboard we are using here has better memory performance than other X299 platforms we have tested.
Intel Core i9-10980XE Cinebench R15
Here are our Cinebench R15 results:
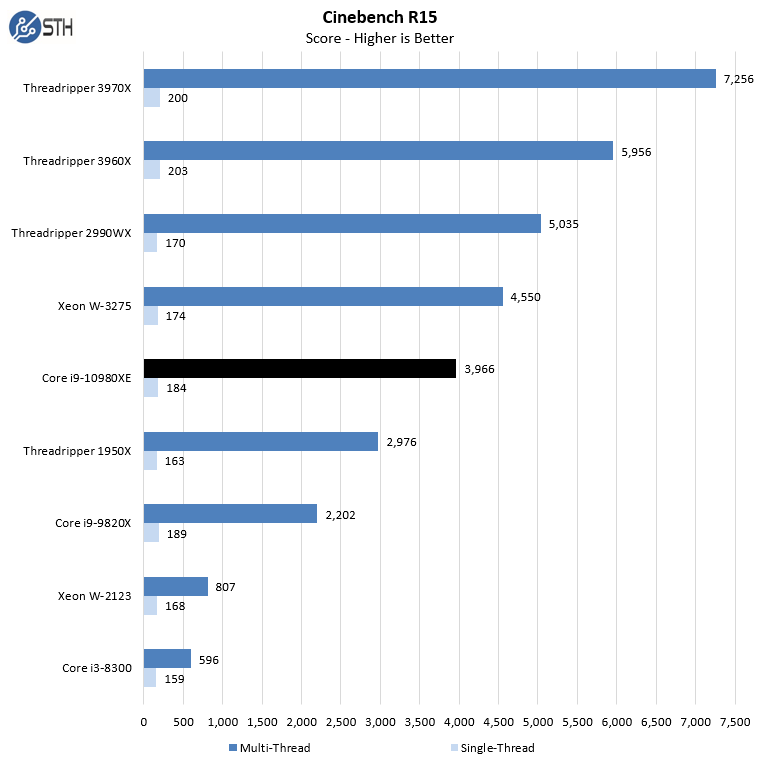
Cinebench R15 is a test where caches matter a great deal and typically it favors AMD architectures. It is not the most indicative of real-world performance and with Cinebench R20 out, we are going to be depreciating this benchmark in the near future.
Intel Core i9-10980XE Cinebench R20
We have not run Cinebench R20 in our reviews but will start doing so in future reviews.
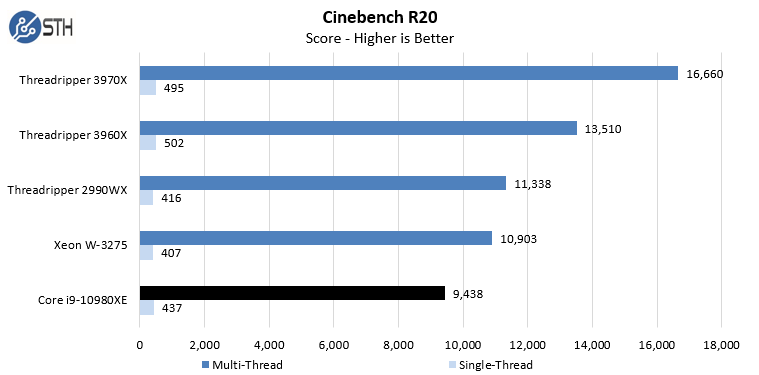
We have only just started using Cinebench R20, it shows the Intel Core i9-10980XE has a difficult time when compared to processors that have larger core counts. At the same time, we are getting relatively solid performance numbers versus the Intel Xeon W-3275 which costs around 4x as much.
Intel Core i9-10980XE Geekbench 4
Geekbench is a popular Windows benchmark.
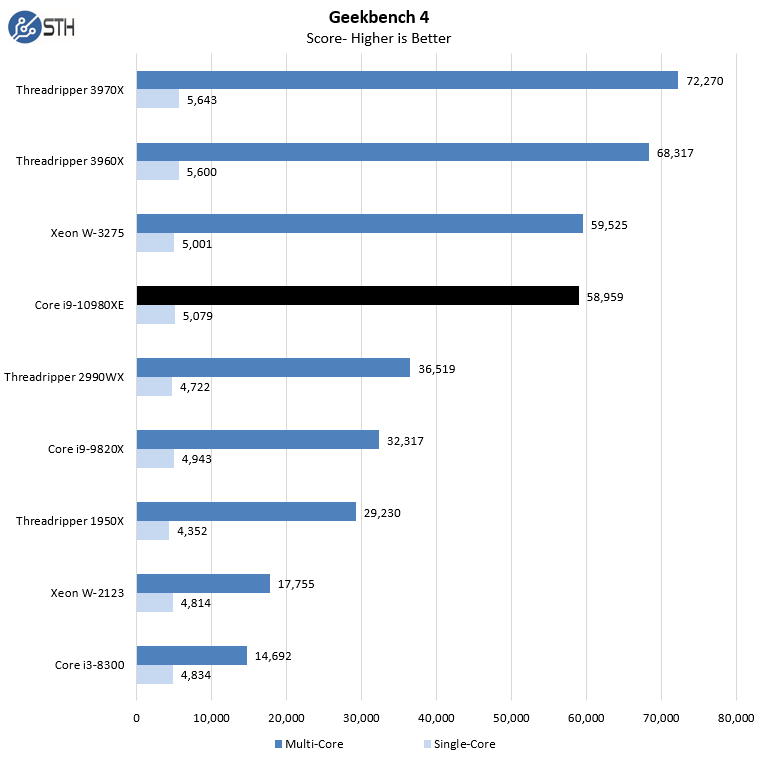
Geekbench is a benchmark that the Intel Core i9-10980XE generates very good results. Although it is popular, it is a benchmark that has clear scaling issues as we saw a few months ago when we did Geekbench 4 2P AMD EPYC 7742 Sets World Record.
Intel Core i9-10980XE 3DMark PCI Express Bandwidth
3DMark feature tests are special tests designed to highlight specific techniques, functions or capabilities. The 3DMark PCI Express feature test is designed to measure the bandwidth available to your GPU over your computer’s PCI Express interface.
The test aims to make bandwidth the limiting factor for performance. It does this by uploading a large amount of vertex and texture data to the GPU for each frame. The result of the test is the average bandwidth achieved during the test.
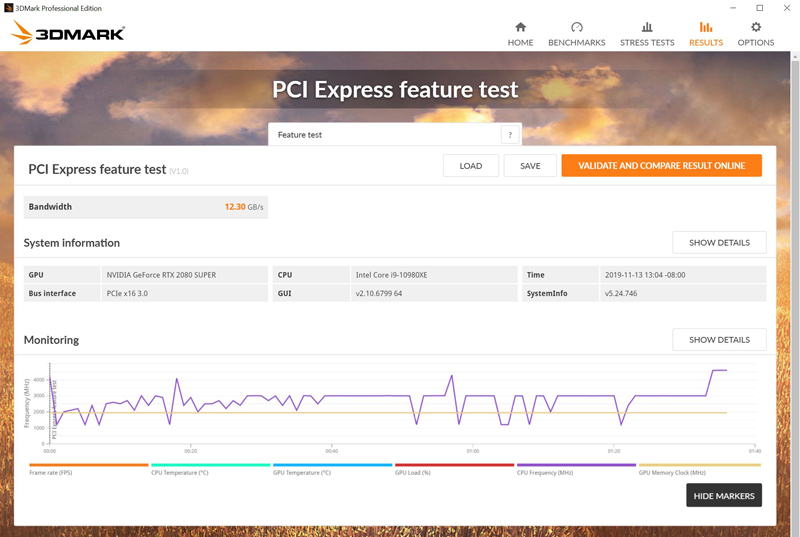
With this test we see 12.30GB/s PCIe bandwidth going to our NVIDIA RTX 2080 SUPER graphics card.
Next, we are going to look at Windows system performance benchmarks.

