Intel Core i3-9300 Benchmarks
For this exercise, we are using our legacy Linux-Bench scripts which help us see cross-platform “least common denominator” results we have been using for years as well as several results from our updated Linux-Bench2 scripts. At this point, our benchmarking sessions take days to run and we are generating well over a thousand data points. We are also running workloads for software companies that want to see how their software works on the latest hardware. As a result, this is a small sample of the data we are collecting and can share publicly. Our position is always that we are happy to provide some free data but we also have services to let companies run their own workloads in our lab, such as with our DemoEval service. What we do provide is an extremely controlled environment where we know every step is exactly the same and each run is done in a real-world data center, not a test bench.
We are going to show off a few results, and highlight a number of interesting data points in this article.
Python Linux 4.4.2 Kernel Compile Benchmark
This is one of the most requested benchmarks for STH over the past few years. The task was simple, we have a standard configuration file, the Linux 4.4.2 kernel from kernel.org, and make the standard auto-generated configuration utilizing every thread in the system. We are expressing results in terms of compiles per hour to make the results easier to read:
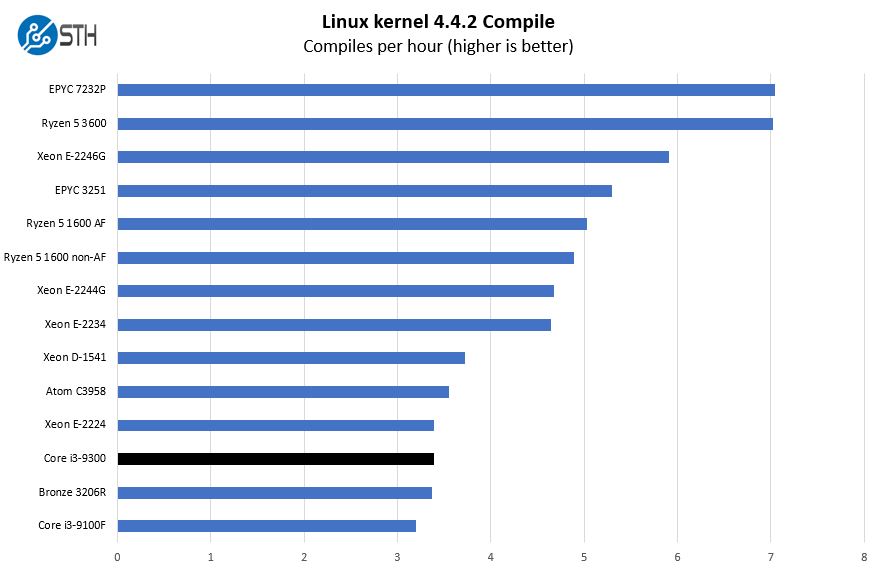
You can see a few themes emerge here. The Core i3-9300 has relatively high clock speeds compared to the non-LGA1151 segments of the Intel stack so you will see the additional clock speed make up for the lack of additional cores. You will also see the Core i3-9300 touch the bottom end of the Xeon E-2200 series range.
c-ray 1.1 Performance
We have been using c-ray for our performance testing for years now. It is a ray tracing benchmark that is extremely popular to show differences in processors under multi-threaded workloads. We are going to use our 8K results which work well at this end of the performance spectrum.
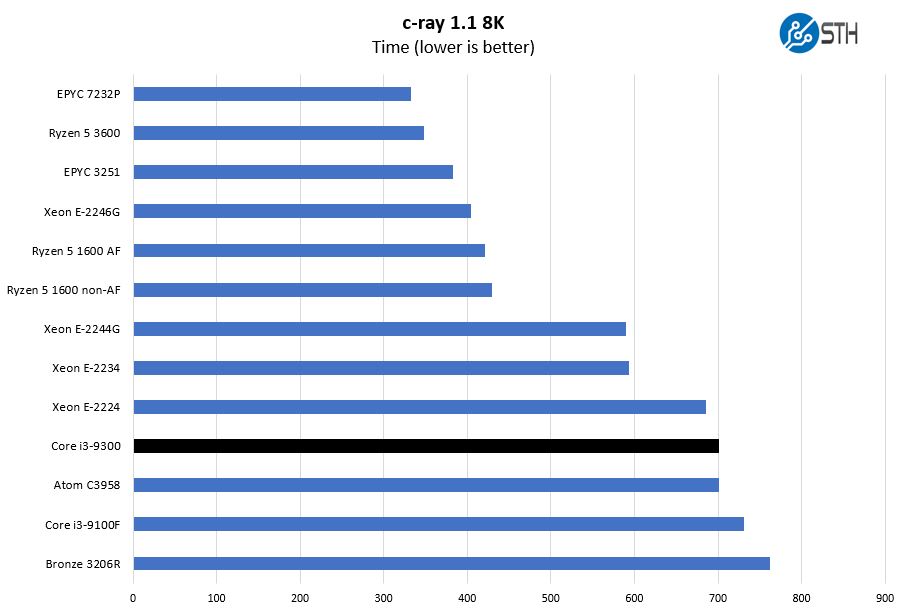
If you want to compare this chip to the majority of the Xeon E-2200 line as well as the Core i3-8300, we are going to point you to our Intel Xeon E-2234 benchmarks and review. We pulled the most relevant Xeon E-2200 series CPUs into these charts but left others out. For example, with twice the number of cores, four times the number of threads, and higher clock speeds the Intel Xeon E-2288G is in a different price/ performance league than the Core i3-9300. If you want to see performance just to see socket scaling, we have some reference points you can use to see the Core i3-9300 in relation to the rest of the stack.
7-zip Compression Performance
7-zip is a widely used compression/ decompression program that works cross-platform. We started using the program during our early days with Windows testing. It is now part of Linux-Bench.
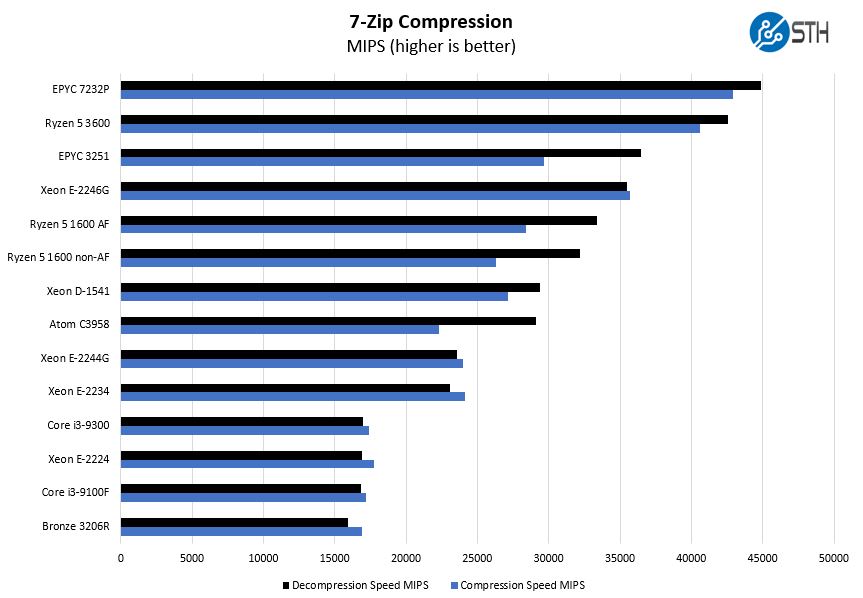
Here we see the Intel Core i3-9300 perform better than the Intel Xeon E-2224 by a small margin on the decompression side. The Xeon part pulls ahead on compression. We traditionally sort this chart by decompression. Still, this is a great chart to highlight how close these chips are in terms of performance.
NAMD Performance
NAMD is a molecular modeling benchmark developed by the Theoretical and Computational Biophysics Group in the Beckman Institute for Advanced Science and Technology at the University of Illinois at Urbana-Champaign. More information on the benchmark can be found here. We are going to augment this with GROMACS in the next-generation Linux-Bench in the near future. With GROMACS we have been working hard to support Intel’s Skylake AVX-512 and AVX2 supporting AMD Zen architecture. Here are the comparison results for the legacy data set:
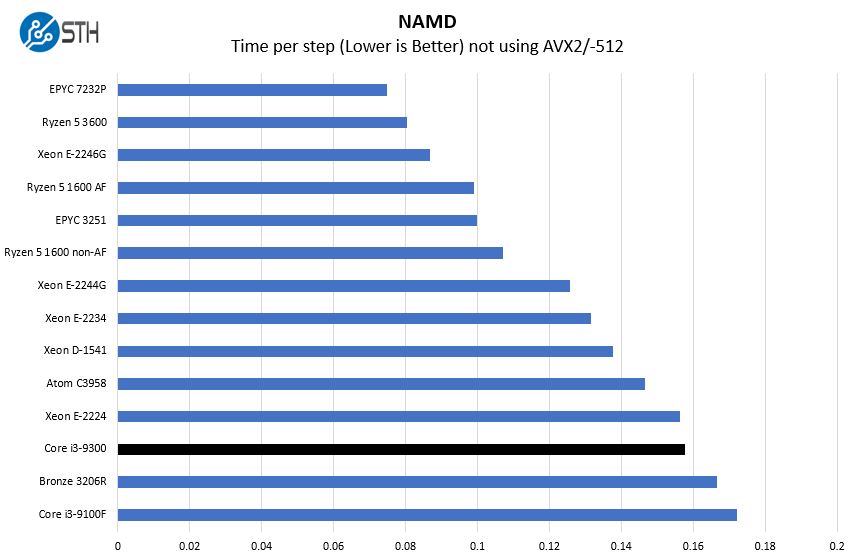
We wanted to quickly point out here that this four-core part is able to keep pace just behind the Intel Atom C3958 a 16-core embedded part. The Core i3-9300 has higher clock speeds and more TDP headroom but if you have the power/ thermals and need more per-core performance, the Core i3-9300 has a lot to offer. Of course, the Atom C3958 has QAT acceleration, 10GbE, and a host of other features, but at the edge, it shows some breadth in terms of offerings out there.
Sysbench CPU test
Sysbench is another one of those widely used Linux benchmarks. We specifically are using the CPU test, not the OLTP test that we use for some storage testing.
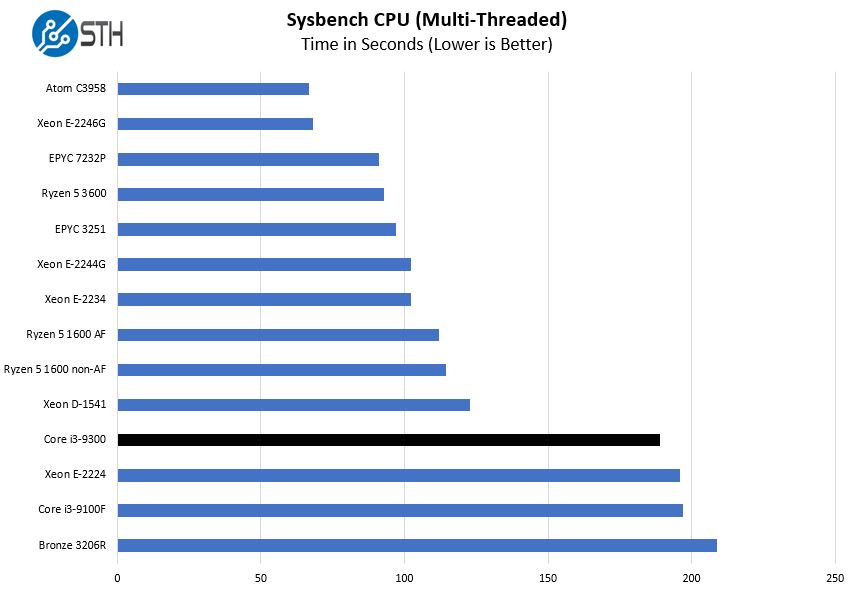
You will notice that we added chips such as the AMD Ryzen 5 1600 AF here. Those are not present in previous reviews. We added them after testing in the ASRock Rack X470D4U and the X470D4U2-2T server motherboards. There is still an enormous gap in terms of platform support for a Core i3-9300 server and an AMD Ryzen server, but we wanted to give some sense of what could happen if AMD decided to enter this market with a well-supported effort.
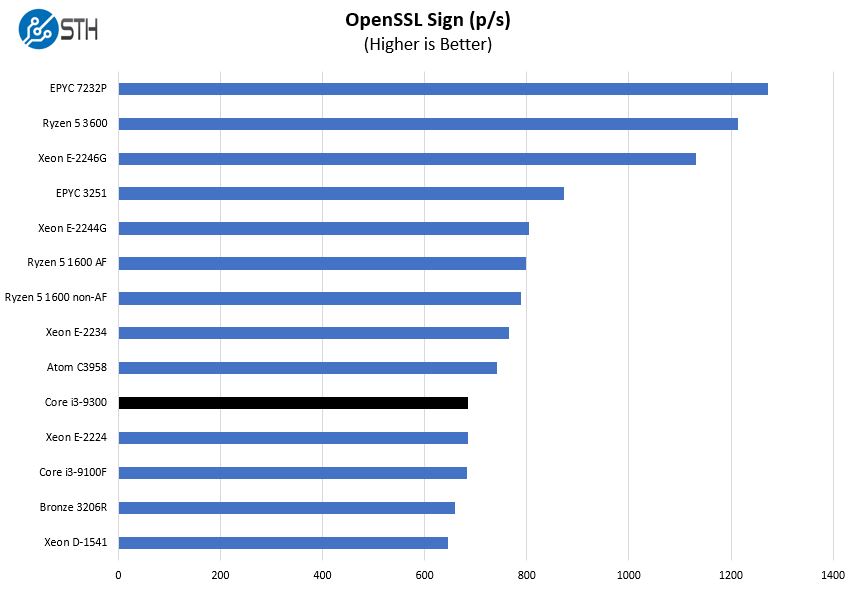
OpenSSL Performance
OpenSSL is widely used to secure communications between servers. This is an important protocol in many server stacks. We first look at our sign tests:
Here are the verify results:
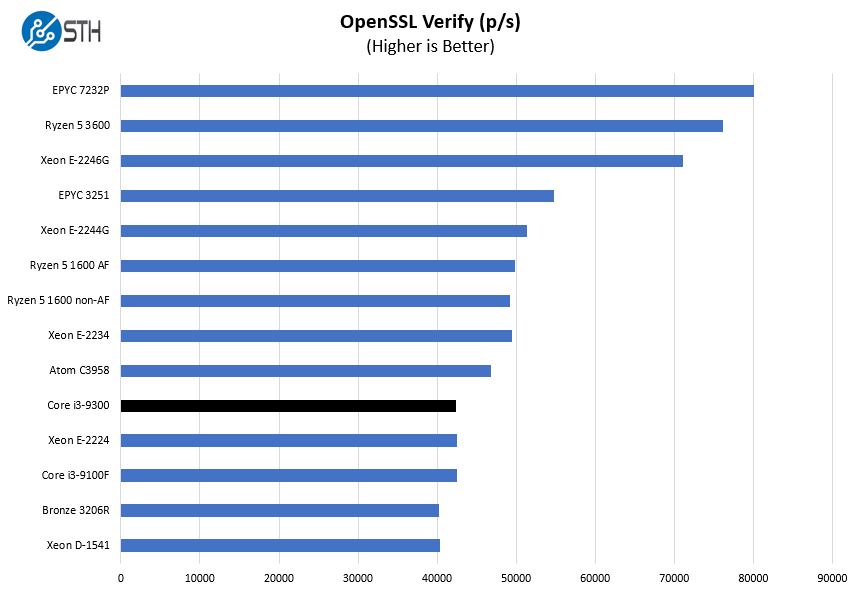
Here the Core i3-9100F, Core i3-9300, and Xeon E-2224 are very tightly grouped. We should mention that while the Core i3-9300 gets iGPU support, the Xeon E-2224 gets support for features such as vPro and TXT. In the server market, vPro is less of a benefit. Some of the lower-end servers such as the Dell PowerEdge T40 use vPro and AMT for management but without the iGPU the Xeon E-2224 does not get some features anyway.
UnixBench Dhrystone 2 and Whetstone Benchmarks
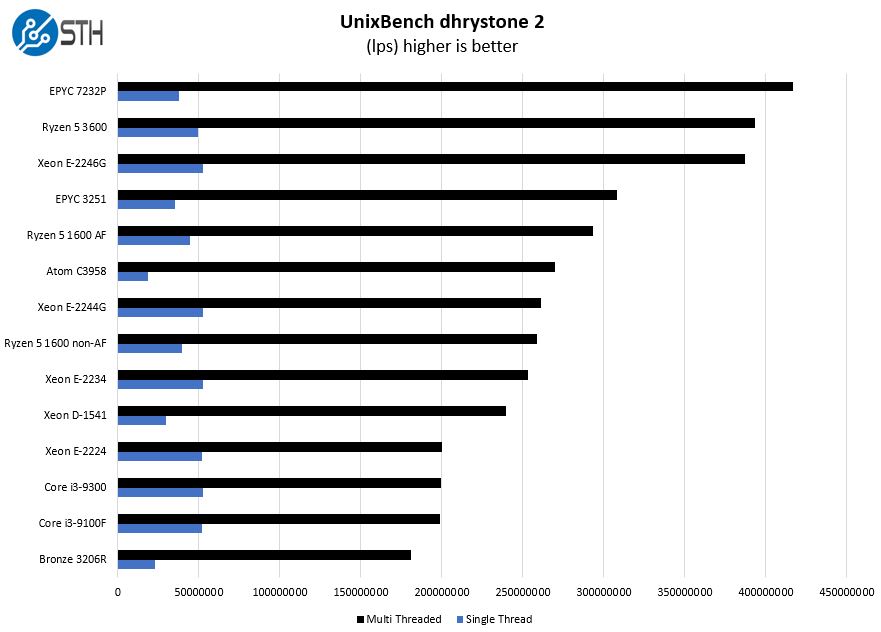
Some of the longest-running tests at STH are the venerable UnixBench 5.1.3 Dhrystone 2 and Whetstone results. They are certainly aging, however, we constantly get requests for them, and many angry notes when we leave them out. UnixBench is widely used so we are including it in this data set. Here are the Dhrystone 2 results:
Here are the whetstone results:
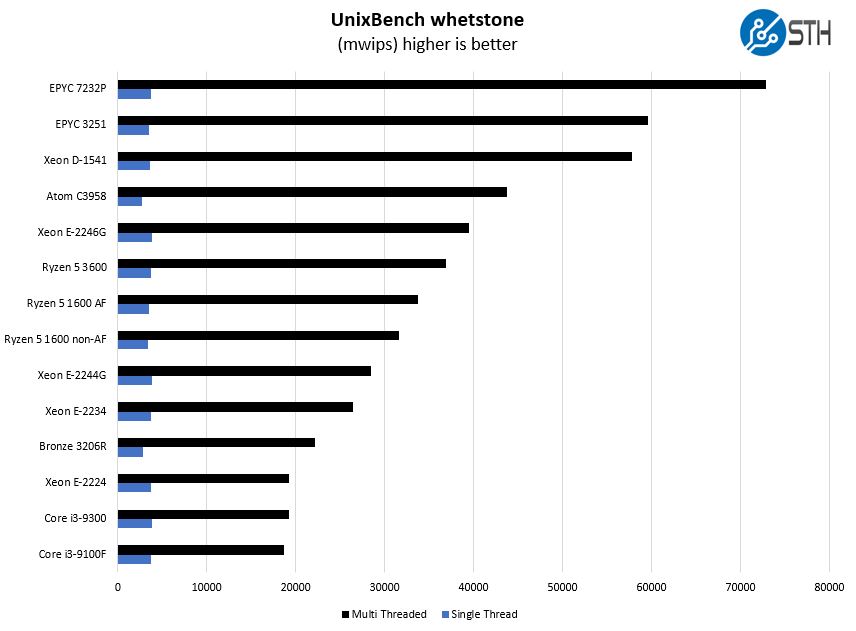
Here we can see performance just below the Xeon E-2224 again. Single thread performance is more in the higher-end tier of chips rather than the embedded parts due to the higher clock speeds. If you look at the top-end of these charts with the AMD EPYC 7232P you can see where the bottom-end of the AMD EPYC 7002 series to see just how much performance you get there.
Chess Benchmarking
Chess is an interesting use case since it has almost unlimited complexity. Over the years, we have received a number of requests to bring back chess benchmarking. We have been profiling systems and are ready to start sharing results:
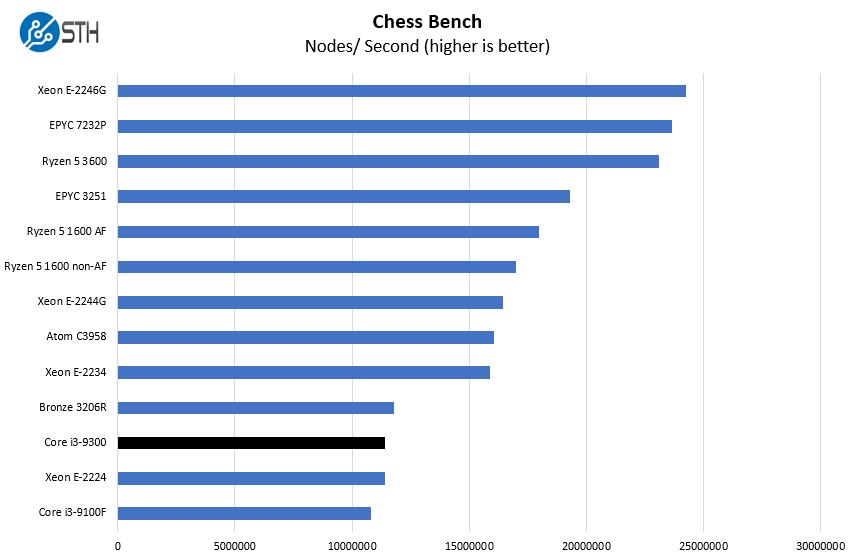
Something you may have noticed is that this part is relatively competitive with the Intel Xeon Bronze 3206R in many cases. That is because while the Xeon Bronze has 8 cores and 8 threads, also without Hyper-Threading, it runs at a much lower 1.9GHz clock speed. Like the EPYC 7232P, the Xeon Bronze 3206R is a gateway to a larger ecosystem as part of the Big 2nd Gen Intel Xeon Scalable Refresh. In contrast, the LGA1151 socket that the Core i3-9300 is used in is lower power and has less expansion capability. While these lines do have some nominal overlap, they are not direct competitors.
Next, we are going to have power consumption, market positioning, and our final words.



Reading this review today I feel like you guys are releasing these in some kind o’ order. You’re releasing this just ‘co-incidentally’ a few days after your X470D4U Ryzen server review? I don’t buy it. You’re ordering these reviews on purpose.
RedManFam – If you are suggesting that we have a content plan, I can assure you we do. It gets updated (often) as new developments occur, but there is a plan.
FYI, Intel has disabled ECC in the new i3s.
Hello. Could you please verify this CPU is vulnerable to Meltdown? Intel lists is as B0 revision what might be the same B0 as Kaby Lake. Thank you.
Powershell script:
https://support.microsoft.com/en-us/help/4073119/protect-against-speculative-execution-side-channel-vulnerabilities-in
For a home server I am looking for a setup with low power consumption while the CPU is idle, as I am assuming that this is the most important figure concerning power costs. Comparing this article with the earlier test of the G5400 the idle power consumption differs by 6W! The article says that the same board was used.
May I ask if this was really the same setup? There are so many factors impacting idle power like fans, enabled ports and so on. Is the difference of 2 cores and 2MB cache causing a difference in idle power of 6W? I would also be interested in a comparison with the E-2236. Does anybody have numbers concerning this?