We wanted to cover the IDC 1Q20 Quarterly Server Tracker results. There were some significant shifts in the market and the data suggests server average selling prices, or ASPs, have dropped 6% year over year and 3% quarter over quarter. We wanted to cover the numbers and see what impacts the first quarter of some global economic challenges had on the server market.
IDC 1Q20 Quarterly Server Tracker
We wanted to show two data excerpts from the press release before getting to our discussion. The first is IDC’s revenue figures showing a market contraction of 6% in the quarter.
| Top 5 Companies, Worldwide Server Vendor Revenue, Market Share, and Growth, First Quarter of 2020 (Revenues are in US$ Millions) | |||||
| Company | 1Q20 Revenue | 1Q20 Market Share | 1Q19 Revenue | 1Q19 Market Share | 1Q20/1Q19 Revenue Growth |
| 1. Dell Technologies | $3,473.70 | 18.70% | $3,993.50 | 20.20% | -13.00% |
| 2. HPE/New H3C Group | $2,891.30 | 15.50% | $3,555.00 | 18.00% | -18.70% |
| 3. Inspur/Inspur Power Systems | $1,324.40 | 7.10% | $1,219.90 | 6.20% | 8.60% |
| T4. Lenovo | $1,043.50 | 5.60% | $1,131.80 | 5.70% | -7.80% |
| T4. IBM | $884.20 | 4.80% | $760.10 | 3.80% | 16.30% |
| ODM Direct | $4,826.40 | 25.90% | $4,549.30 | 23.00% | 6.10% |
| Rest of Market | $4,168.30 | 22.40% | $4,588.40 | 23.20% | -9.20% |
| Total | $18,611.80 | 100.00% | 19,797.90 | 100.00% | -6.00% |
| Source: IDC Worldwide Quarterly Server Tracker, June 9, 2020 | |||||
Given the earnings announcements we have seen from major players, and some major economic headwinds, this makes a lot of sense.
Despite the negative revenue trend, unit growth was relatively steady on a year/ year basis with only a 0.2% decline.
| Top 5 Companies, Worldwide Server Unit Shipments, Market Share, and Growth, First Quarter of 2020 | |||||
| Company | 1Q20 Unit Shipments | 1Q20 Market Share | 1Q19 Unit Shipments | 1Q19 Market Share | 1Q20/1Q19 Unit Growth |
| 1. Dell Technologies | 474,011 | 18.40% | 516,997 | 20.00% | -8.30% |
| 2. HPE/New H3C Group | 377,544 | 14.70% | 411,124 | 15.90% | -8.20% |
| 3. Inspur/Inspur Power Systems | 211,007 | 8.20% | 204,868 | 7.90% | 3.00% |
| T4. Lenovo | 153,570 | 6.00% | 137,474 | 5.30% | 11.70% |
| T4. Super Micro | 132,001 | 5.10% | 135,508 | 5.30% | -2.60% |
| ODM Direct | 770,446 | 29.90% | 651,357 | 25.20% | 18.30% |
| Rest of Market | 456,841 | 17.70% | 523,194 | 20.30% | -12.70% |
| Total | 2,575,439 | 100.00% | 2,580,522 | 100.00% | -0.20% |
| Source: IDC Worldwide Quarterly Server Tracker, June 9, 2020 | |||||
Dell and HPE saw almost identical percentage drops. Inspur increased 3% along with an 11.7% rise in Lenovo. We covered this in our IDC 4Q19 Quarterly Server Tracker piece but Lenovo made a major shift in 2020 to a higher volume, lower-cost server model which is driving a lot of this annual unit growth.
In this quarter’s server tracker, Huawei has fallen out of the top 5 for both unit volumes and revenue. On the unit shipment side, we see Supermicro join the list. IBM had a fairly massive revenue jump, but on fewer systems so they are a top 5 in revenue player, but not unit volume. Supermicro sells lower ASP servers than IBM, so it makes the top 5 unit shipment list but not the revenue top 5.
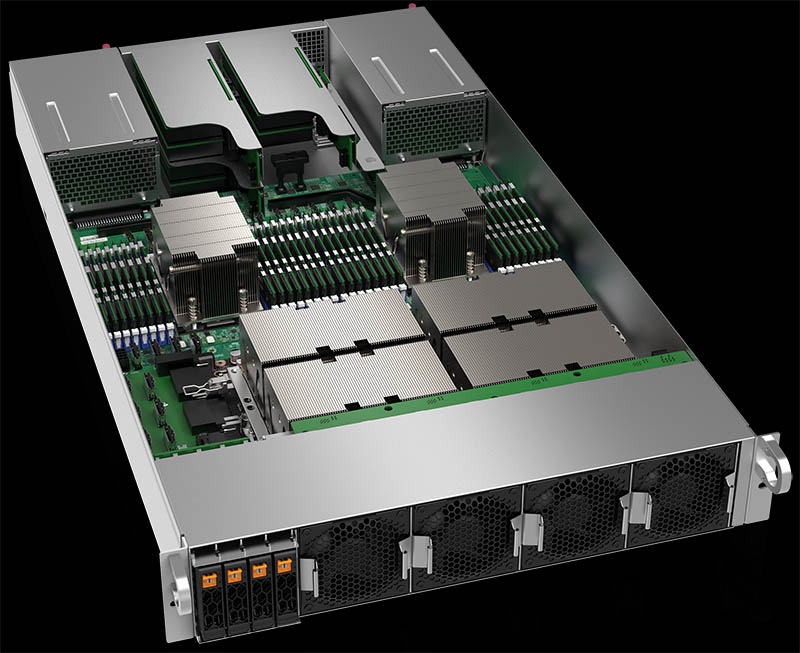
Since we have -6% revenue and a -0.2% unit shipment, that tells us that server ASPs have fallen.
Annual and Quarterly Server ASP Movement
When we look at year/ year ASP performance, we can see a fairly clear trend that is leading to that drop:
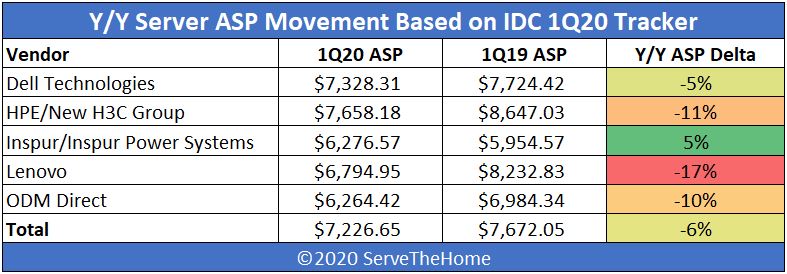
The majority of the market saw an ASP contraction on an annual basis. Many vendors being tracked lost more than the average of negative 6% ASP. HPE and Lenovo, along with even the ODM direct category fell by double digits according to IDC’s data. Dell did slightly better at -5%. Inspur actually notched a 5% increase. Inspur sells a lot of accelerated systems. We reviewed the Inspur NF5488M5 server with its 8x Tesla V100 GPUs, a server well over the company’s $6,277 server ASP this quarter. It shows how on 3% unit growth, Inspur is increasing ASPs even more.
When we take a look at the quarterly numbers, we see something perhaps equally as interesting:
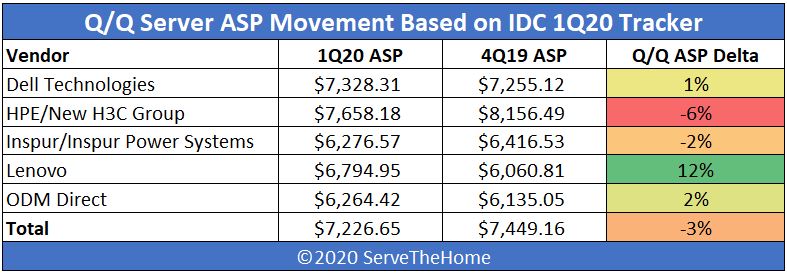
In the +/- 2% range, or effectively fairly flat in terms of ASPs, we see Dell, Inspur, and the ODM Direct bucket. That range is also all better than the industry average in the -3% range.
HPE saw a large drop with a 6% ASP decline on a quarterly basis. The 6% quarterly decline may seem large, but one should keep in mind that, based on IDC data, the 4Q18 ASP for a HPE server was well over $8,833. Effectively between 4Q18 and 1Q20 HPE has seen its server ASPs decline by more than 13%. HPE is still above the industry average ASP while its larger competitor Dell is below.
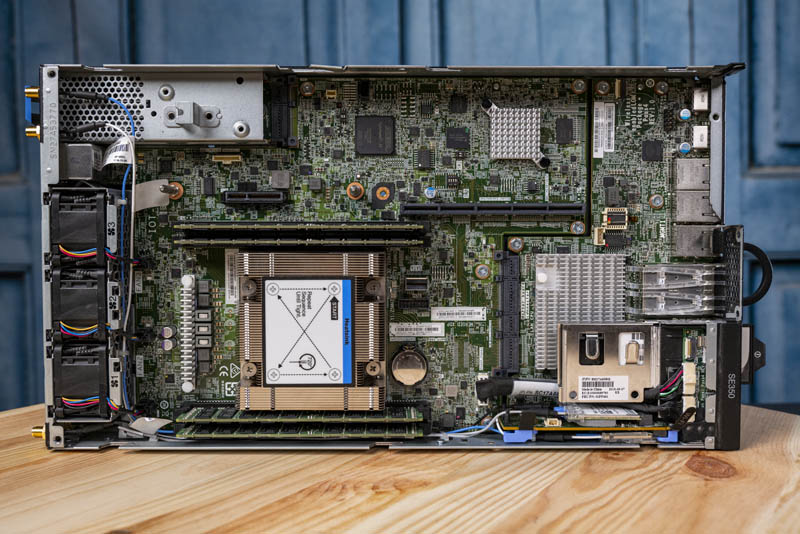
Lenovo saw a 12% bounce in the Q/Q ASP data. That is a big jump, but there is a caveat. Its 4Q18 ASP was $7,633. While this is still a massive quarterly jump, Lenovo is seeing the unit volume increase while ASPs are down 11% from 4Q18. While Lenovo had been above industry averages, it is now below the line.
Final Words
There is a lot that happened in the first quarter of 2020. We had a global pandemic shutting down a lot of trade. It also shifted the types of servers we needed. For example, there was a lot more buzz around VPN and VDI than smart retail.
The first quarter also saw the Big 2nd Gen Intel Xeon Scalable Refresh. That “refresh” effectively lowered prices and offered massive performance for what we estimate to be 75-85% of Intel’s 2nd Gen Xeon Scalable SKU volume. Intel also said that it was going to ship the Socket P+ Cooper Lake product but would not ship the Whitley version, effectively delaying the Whitley platform launch for additional quarters. We expect Cooper Lake/ Cedar Island to impact the 4/8 socket server market outside of Facebook’s deployment.
Summing up, we had macroeconomic forces putting downward pressure on ASPs. At the same time, the Intel-AMD competition heated up. The subtle note is that Intel’s platform roadmap also changed. Effectively, the server vendors are still selling (mostly) Intel Xeon Scalable platforms. These are the same platforms that launched almost three years ago, albeit with two processor refreshes and an Optane DCPMM capability added. Aside from the macroeconomic headwinds in 2020, the start of 3Q20 is when these platforms will have been in the market for three years putting them in almost uncharted territory.
A dual-socket Intel Xeon Scalable buyer in August will be buying the same Dell EMC PowerEdge R740(xd) that came out over three years beforehand. That same server buyer will know that holding off purchases a few quarters more will mean Ice Lake Xeon servers with up to 38 cores, 2nd Generation Optane DCPMM, PCIe Gen4, and Intel’s PCIe Gen4 component ecosystem such as SSDs and accelerators that are awaiting the new platform enablement. There will be a point in 2020 when those 3+ year old servers based on 2012-era PCIe Gen3 technology are going to start looking old.
2020 is going to be unlike what we have seen in many years.


Patrick: based on your above data charts, can you come to any conclusion of how successfully Amd Epyc is competing with Intel Xeon SP server based systems??
I get the feeling that as soon as Ice Lake servers start selling, that will be the maximum server share that Amd will attain to as most companies will not buy into performance compare to the stability of a known computer architecture.
basil thomas – going to discuss that topic a bit more after this next week of coverage. I have thoughts.