We wanted to cover the IDC 2Q20 Quarterly Server Tracker results, even if we are a bit late on them. IDC reported that amid the global pandemic, server shipments and revenue grew on both a quarterly and annual basis. As we have been doing for several quarters now, we wanted to take a look at what the impacts are on the market.
IDC 2Q20 Quarterly Server Tracker
We wanted to show two data excerpts from the press release before getting to our discussion. The first is IDC’s revenue figures showing a market growth of 19.8% comparing to a year-ago quarter. For some context, the 1Q20 to 1Q19 numbers saw a contraction of 6%. This is a big move.
| Top 5 Companies, Worldwide Server Vendor Revenue, Market Share, and Growth, Second Quarter of 2020 (Revenues are in US$ Millions) | |||||
| Company | 2Q20 Revenue | 2Q20 Market Share | 2Q19 Revenue | 2Q19 Market Share | 2Q20/2Q19 Revenue Growth |
| T1. HPE/New H3C Group | $3,582.40 | 14.90% | $3,646.40 | 18.20% | -1.80% |
| T1. Dell Technologies | $3,339.80 | 13.90% | $3,793.30 | 18.90% | -12.00% |
| 3. Inspur/ Inspur Power Systems | $2,532.90 | 10.50% | $1,431.00 | 7.10% | 77.00% |
| T4. Lenovo | $1,466.60 | 6.10% | $1,212.30 | 6.00% | 21.00% |
| T4. IBM | $1,449.70 | 6.00% | $1,188.60 | 5.90% | 22.00% |
| ODM Direct | $6,917.60 | 28.80% | $4,232.70 | 21.10% | 63.40% |
| Rest of Market | $4,748.10 | 19.80% | $4,563.50 | 22.70% | 4.00% |
| Total | $24,037.10 | 100.00% | $20,067.80 | 100.00% | 19.80% |
| Source: IDC Worldwide Quarterly Server Tracker, September 8, 2020 | |||||
In comparison, the 1Q20 numbers were around $18.6B so this is a ~20% Y/Y and 29% Q/Q gain which is a big move. Of course, we also need to take a look at the units shipped by each of the vendors since that is an important context. We have two IBM Power 9 systems in the lab, but those dual-socket nodes tend to sell for more than their x86 counterparts. As a result, IBM is top 5 on the revenue side, but not necessarily on the units shipped. Here is IDC’s top 5 in unit shipments:
| Top 5 Companies, Worldwide Server Unit Shipments, Market Share, and Growth, Second Quarter of 2020 (Revenues are in US$ Millions) | |||||
| Company | 2Q20 Unit Shipments | 2Q20 Market Share | 2Q19 Unit Shipments | 2Q19 Market Share | 2Q20/2Q19 Unit Growth |
| T1. HPE/New H3C Group | 456,642 | 14.30% | 443,632 | 16.50% | 2.90% |
| T1. Dell Technologies | 432,556 | 13.60% | 479,941 | 17.80% | -9.90% |
| 3. Inspur/ Inspur Power Systems | 353,329 | 11.10% | 231,404 | 8.60% | 52.70% |
| 4. Lenovo | 193,086 | 6.10% | 181,165 | 6.70% | 6.60% |
| T5. Supermicro | 152,411 | 4.80% | 139,289 | 5.20% | 9.40% |
| T5. Huawei | 138,849 | 4.40% | 116,994 | 4.30% | 18.70% |
| ODM Direct | 1,096,765 | 34.40% | 678,940 | 25.20% | 61.50% |
| Rest of Market | 364,257 | 11.40% | 420,092 | 15.60% | -13.30% |
| Total | 3,187,894 | 100.00% | 2,691,457 | 100.00% | 18.40% |
| Source: IDC Worldwide Quarterly Server Tracker, September 8, 2020 | |||||
An intriguing metric that immediately jumps out is that the revenues grew at a higher rate than unit shipments. That means we actually saw a net increase in average selling prices.
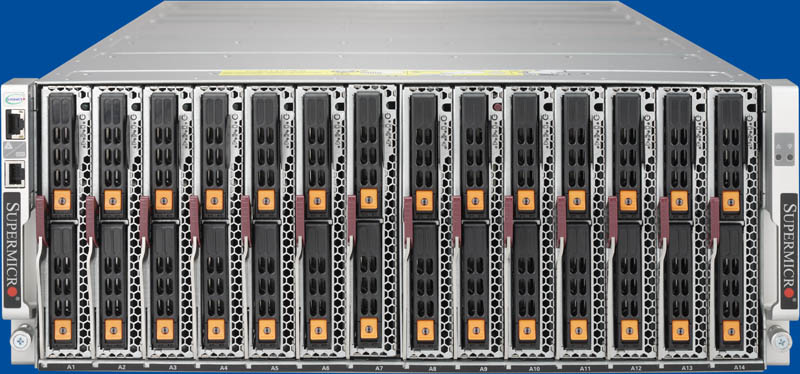
Huawei moved back into a virtual tie with Supermicro with around 4-5% over the market. Still, there are some major moves in this chart that we wanted to discuss. Supermicro sells lower ASP servers than IBM, so it makes the top 5 unit shipment list but not the revenue top 5 and IBM the converse.
Despite the negative revenue trend, unit growth was relatively steady on a year/ year basis with only a 0.2% decline.
The headline may be that HPE took the unit and revenue shipment crown from Dell. That is a spot that Dell EMC vigorously advertised when they became #1, now they are in a tie for the top spot, but lower and on a negative trajectory. You can see our recent Dell EMC PowerEdge C6525 review here:
Annual and Quarterly Server ASP Movement
When we look at year/ year ASP performance, we can see some big moves:
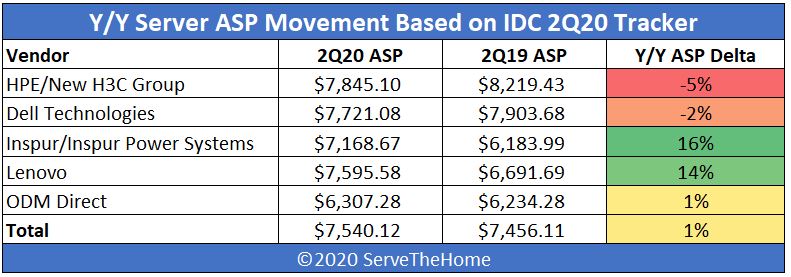
Lookin at HPE and Dell, we see ASP drops while the market ASP stayed relatively flat. This was more pronounced for Dell than for HPE. Let us take a look at the quarterly numbers, we see something perhaps equally as interesting:
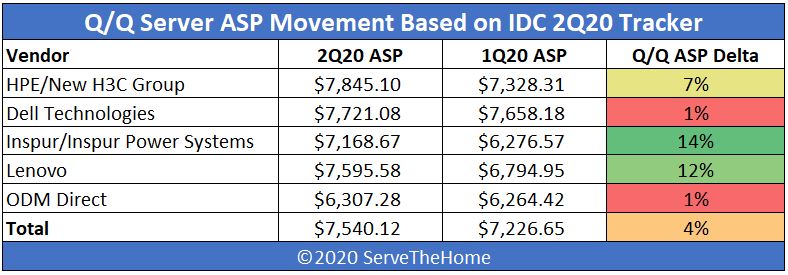
On a quarterly basis, HPE actually grew ASP’s above the market rate while Dell grew ASPs, but at a lower than market rate mirroring the moves in the ODM Direct space. On a quarterly basis, HPE jumped back to a leading ASP while Dell is only slightly above the industry average. Lenovo is almost directly on the industry average ASP.
We just wanted to point out quickly here that the days of HPE and Dell EMC being the dominant vendors are perhaps over. The two now combine for under 28% of the market. Adding Lenovo in, and one barely breaks a third of the market. These are the companies, along with IBM, Cisco, and a few other players, that have heavily customized management stacks. Most of these players are now selling servers with “industry standard” BMC’s and firmware. As a result, the correct way to think about the server industry now is not that “everyone uses Dell/ HPE/ Lenovo” management tools. Rather, more than two-thirds of the industry does not, and that ratio is moving away from the traditional vendors. A big part of that shift is to hyper-scalers and cloud providers, but the industry is squarely moving.
In 3Q19, HPE and Dell EMC had over 31% of the market together. More than 3% of the market migrating in a year is a major move even as Dell and HPE are cutting ASPs to reduce the impact of the shift.
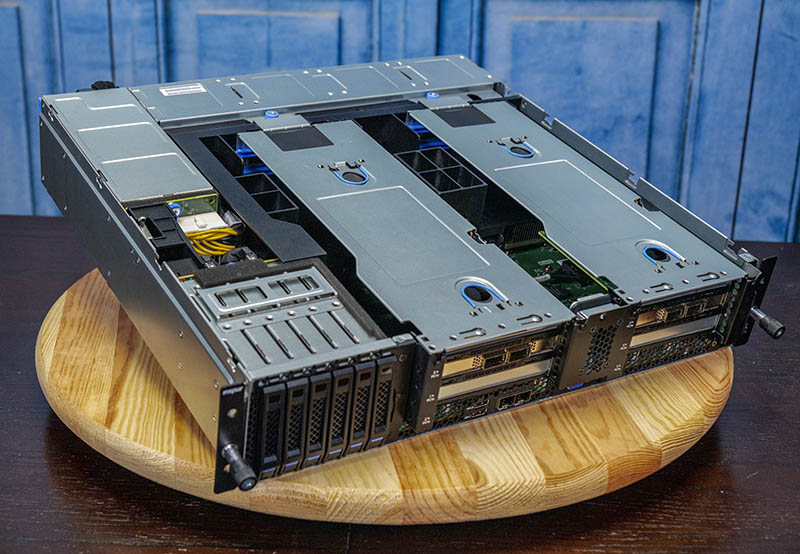
Benefiting from the shift seems to be Inspur and Lenovo. Both companies reported large ASP growth along with unit and revenue growth. Inspur has been on an absolutely huge growth curve. We showed how Inspur did this with our Visiting the Inspur Intelligent Factory Where Robots Make Cloud Servers but the company has now expanded US manufacturing operations. If you saw our recent Inspur NE5260M5 Review that was a server assembled in California, USA instead of Jinan, China.
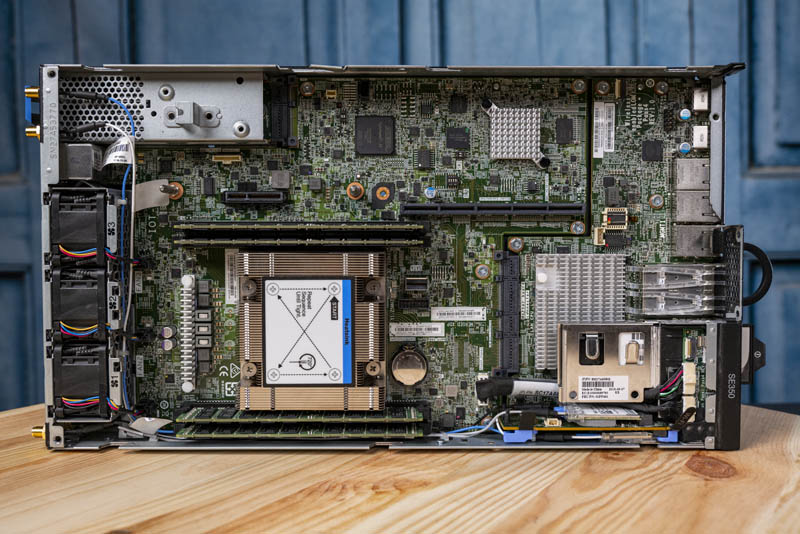
In our IDC 4Q19 Quarterly Server Tracker coverage, we noted how Lenovo embarked on a campaign to drive unit volume at the expense of ASPs. It now has above average ASPs with strong unit growth. We saw this at work with how Lenovo’s new platforms such as the Lenovo ThinkSystem SE350 represent a premium edge server over units such as the HPE ProLiant EC200a (both based on Xeon D lines.)
The ODM direct market may have seen muted ASP growth, but a huge growth in units shipped. This seems to align with Intel’s guidance that hey had a blowout period with hyper-scalers consuming a lot of hardware. We covered the $5B Server Vendor You Probably Have Never Heard Of Wiwynn years ago so we know there are some big players in that space that are growing rapidly.
Final Words
Q3 and Q4 of 2020 are going to be extremely interesting. There are some headwinds as we covered in our The 2021 Intel Ice Pickle How 2021 Will be Crunch Time where we are seeing a quick PCIe Gen4 to Gen5 transition. If the economy turns for the worse, we may be in an environment where frugal buyers are reluctant to make technology transitions.
The rest of 2020 should be quite interesting to see how the market stacks up. What is clear is that the big US vendors are contracting in terms of hardware sales while Chinese/ Taiwanese vendors are growing at a blistering clip. Another storyline to watch is what happens as the market transitions to mostly “industry-standard” management and serviceability standards driven by hyper-scale customers versus what large legacy vendors have dictated to the market for years. It will be interesting to see how HPE (iLO) or Dell EMC (iDRAC) management suites and sales deal with the pronounced market shift away from proprietary solutions. The IDC 2Q20 tracker is yet another link in that chain showing a customer migration toward more open standards.

