HP FX900 1TB Performance Testing
We test using both the default smaller test size as well as larger test sets on our benchmarks. This allows us to see the difference between lighter and heavier workloads.
CrystalDiskMark x64
CrystalDiskMark is used as a basic starting point for benchmarks as it is something commonly run by end-users as a sanity check.
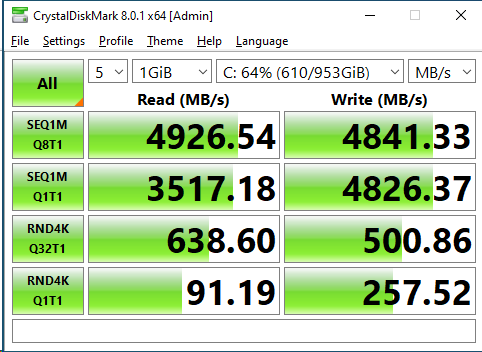
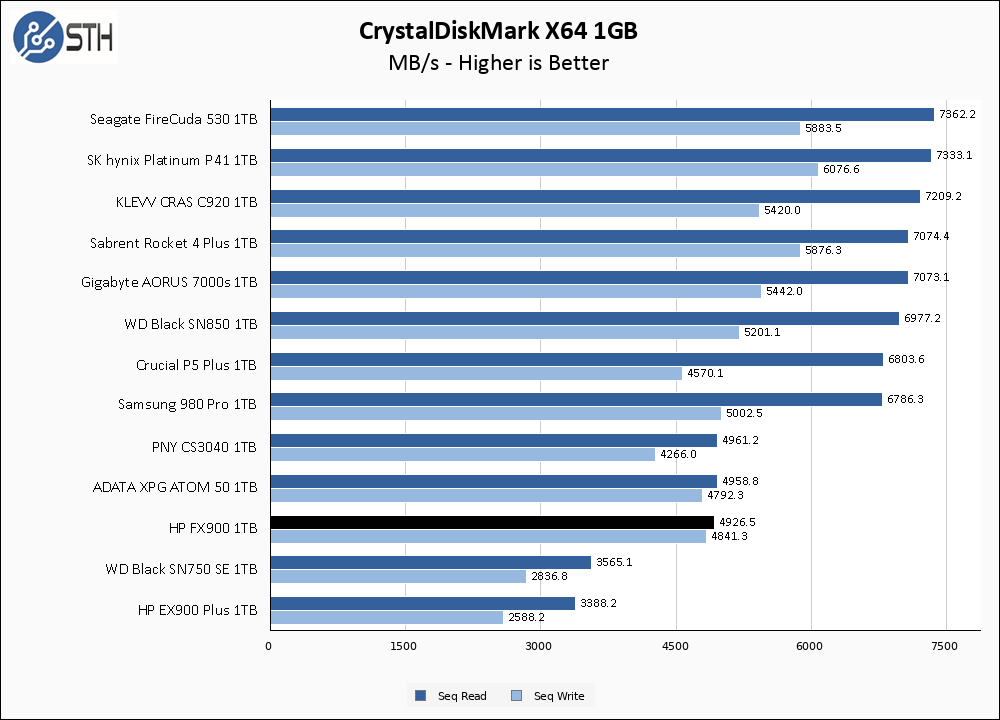
The HP FX900 1TB does a good job of hitting its rated speeds. In addition to that, the FX900 is in a neck-and-neck race with the XPG ATOM 50, which makes sense considering their target market and specs. The FX900 manages to handily beat the PCIe 3.0 HP EX900 Plus and the PCIe 4.0-in-name-only WD SN750 SE.
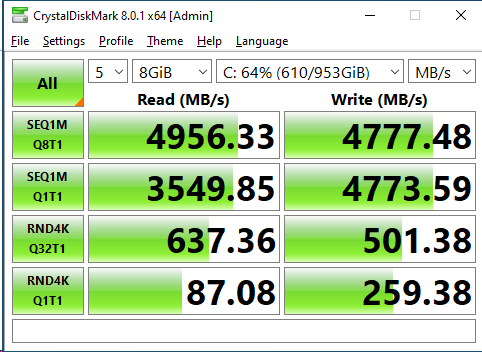
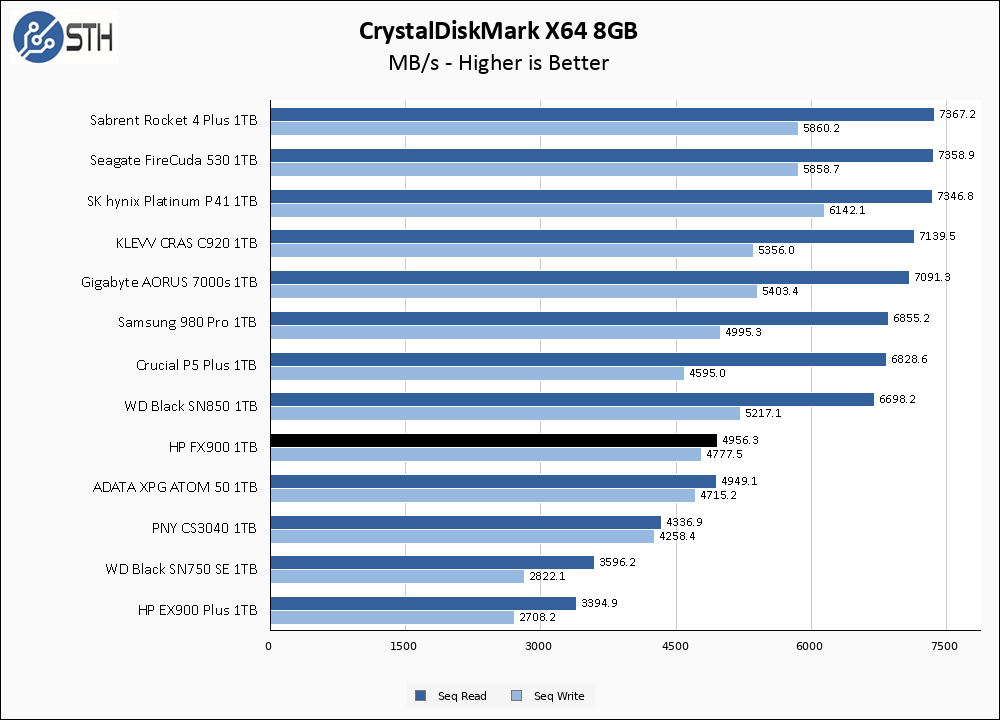
Performance holds steady on the larger CrystalDiskMark test, which is exactly what I want to see out of a SSD. CrystalDiskMark is basically the ‘easiest’ benchmark I run, so not stumbling on the easy tests is the bare minimum I expect out of a drive.
ATTO Disk Benchmark
The ATTO Disk Benchmark has been a staple of drive sequential performance testing for years. ATTO was tested at both 256MB and 8GB file sizes.
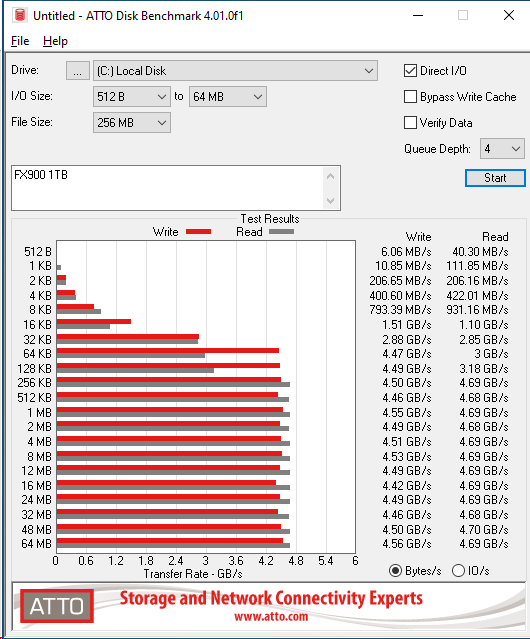
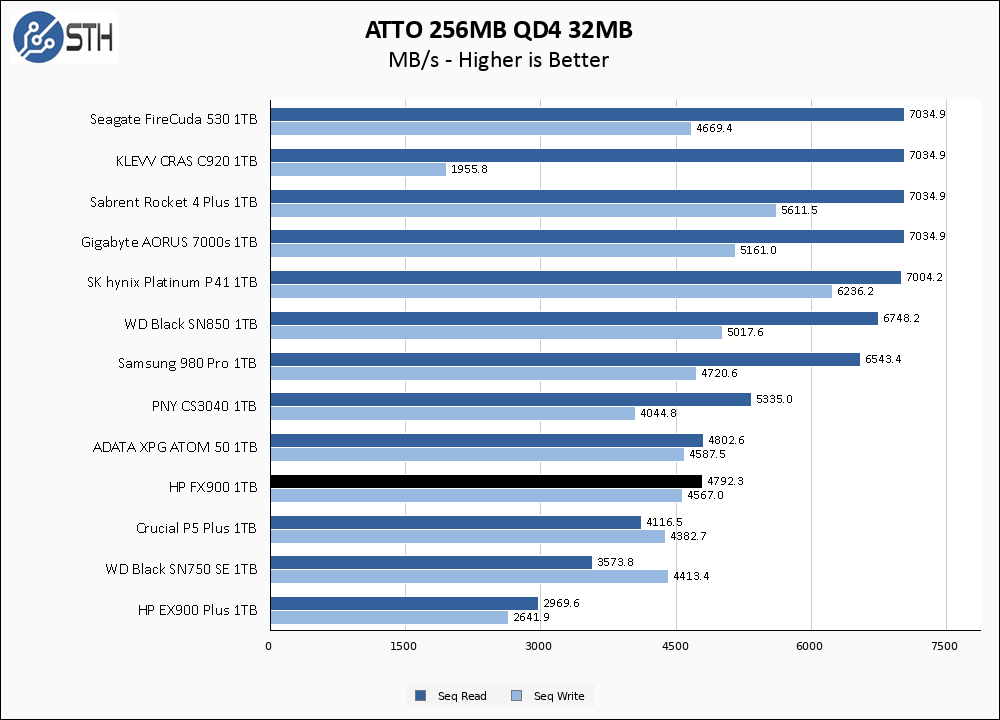
In ATTO once again the HP FX900 is fighting it out with the ATOM 50. Performance sticks relatively close to the rated numbers, though as normal ATTO results are slightly below CrystalDiskMark numbers.
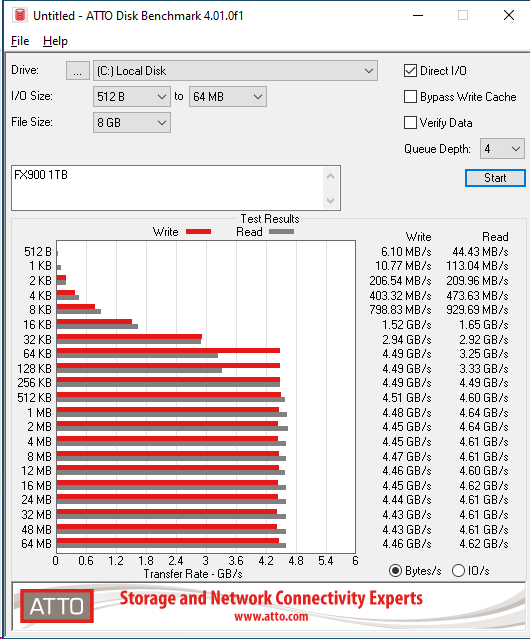
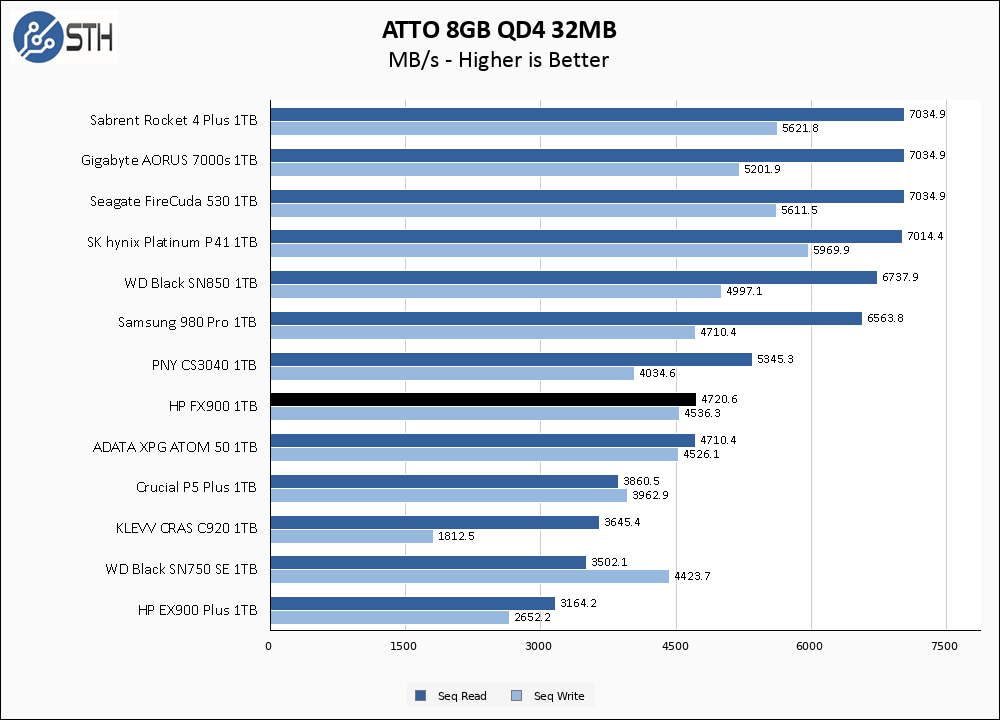
The larger ATTO results also hold steady, which is not always a given. Overall the FX900 puts in a better show in ATTO than the KLEVV CRAS C920.
Anvil’s Storage Utilities
Anvil’s Storage Utilities is a comprehensive benchmark that gives us a very in-depth look at the performance of drives tested. This benchmark was run with both a 1GB and 8GB test size.
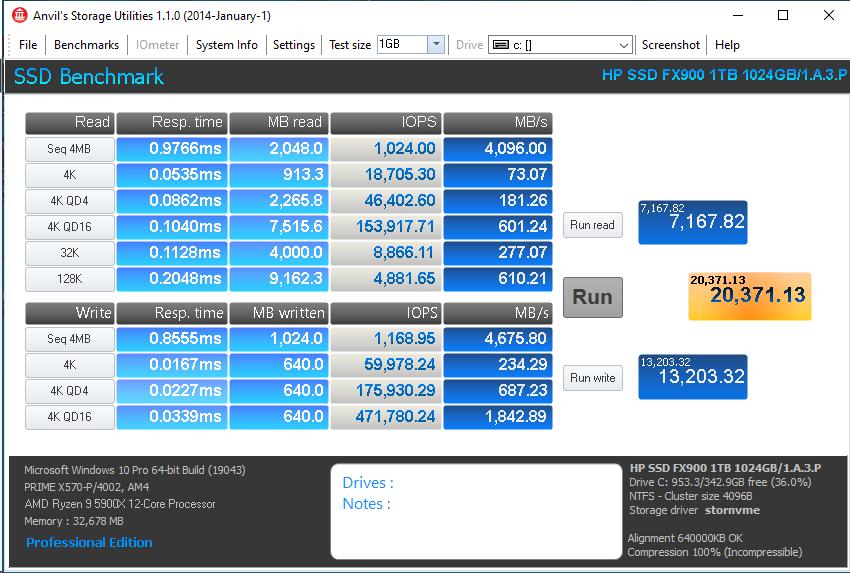
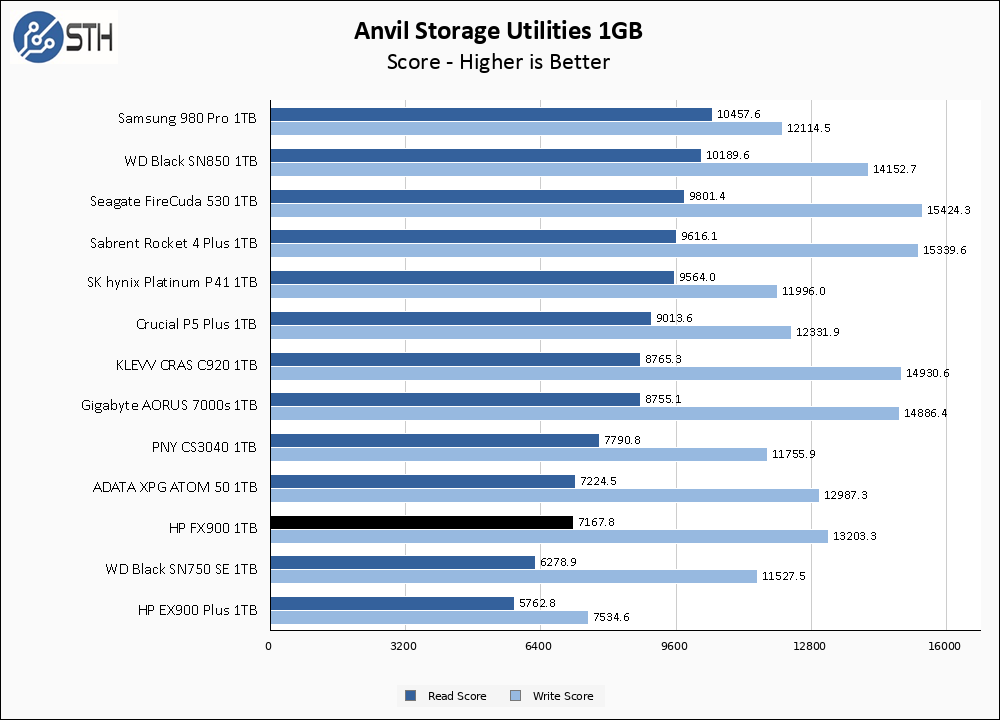
In Anvil, the HP FX900 1TB manages a tiny bit of separation from the ATOM 50 when it comes to write score. Other than that, performance continues to hold towards the bottom of the PCIe 4.0 chart, but still clearly outpacing the PCIe 3.0 drives.
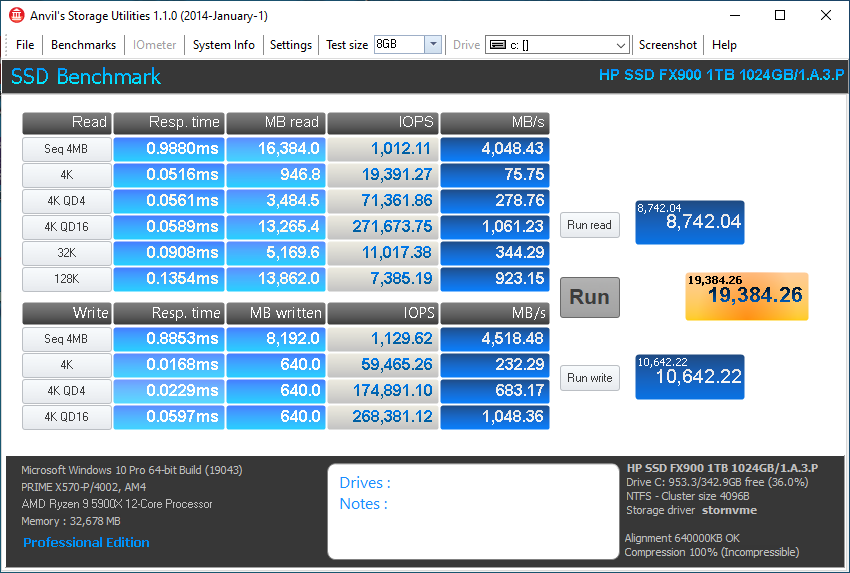
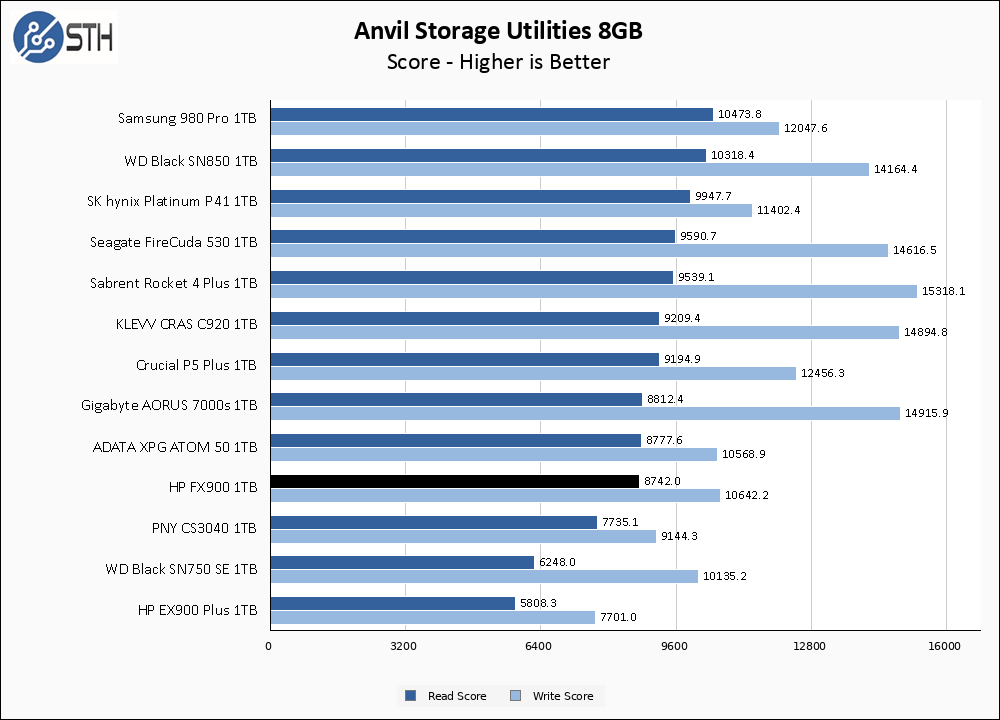
In the larger Anvil test, the FX900 manages to improve its read score while losing just a bit on its write score. This relatively strong hold in performance allows the FX900 to compete favorably versus the PNY CS3040 and move up exactly one rung on our chart.
AS SSD Benchmark
AS SSD Benchmark is another good benchmark for testing SSDs. We run all three tests for our series. Like other utilities, it was run with both the default 1GB as well as a larger 10GB test set.
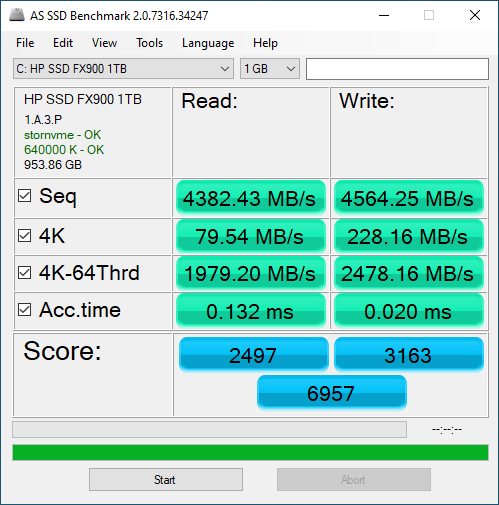
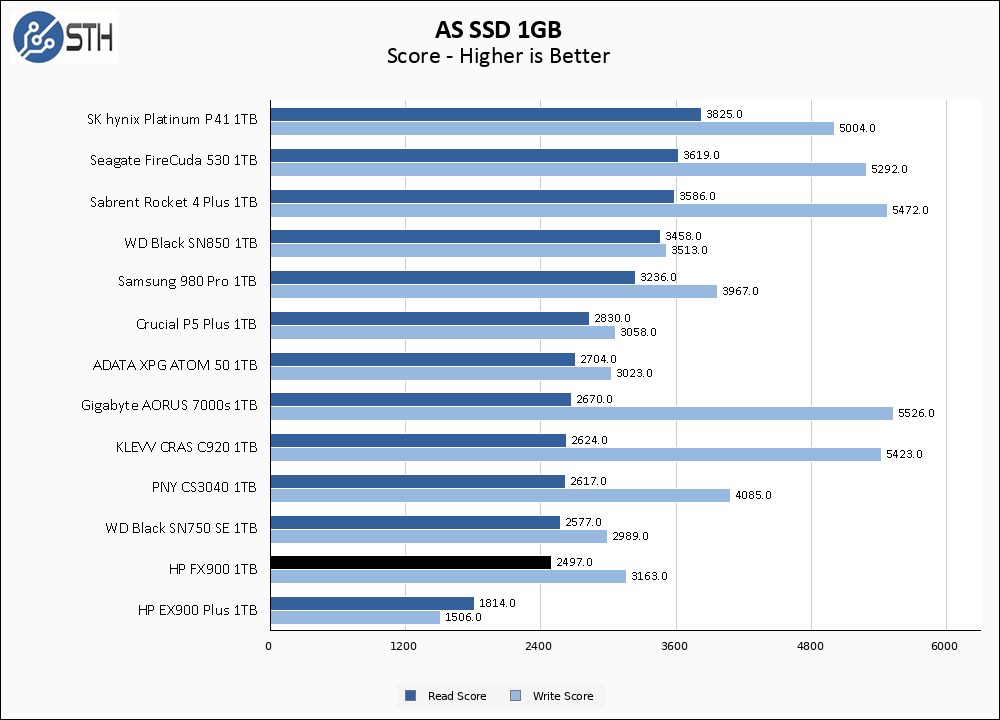
AS SSD represents the clearest separation from the ATOM 50 we have seen yet; unfortunately this separation is not in the FX900’s favor. Here the FX900 just manages to fend off the PCIE 3.0 drives and ends up competing with the WD Black SN750 SE.
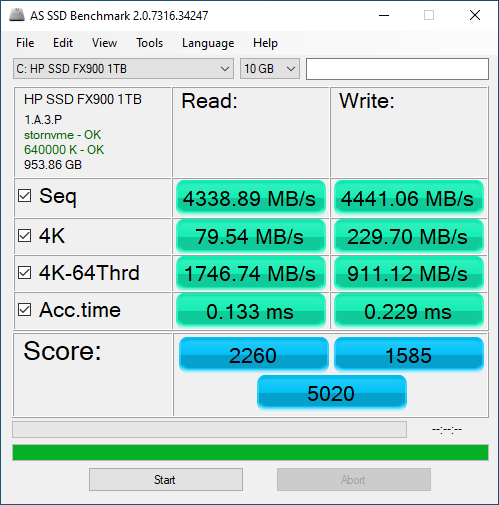
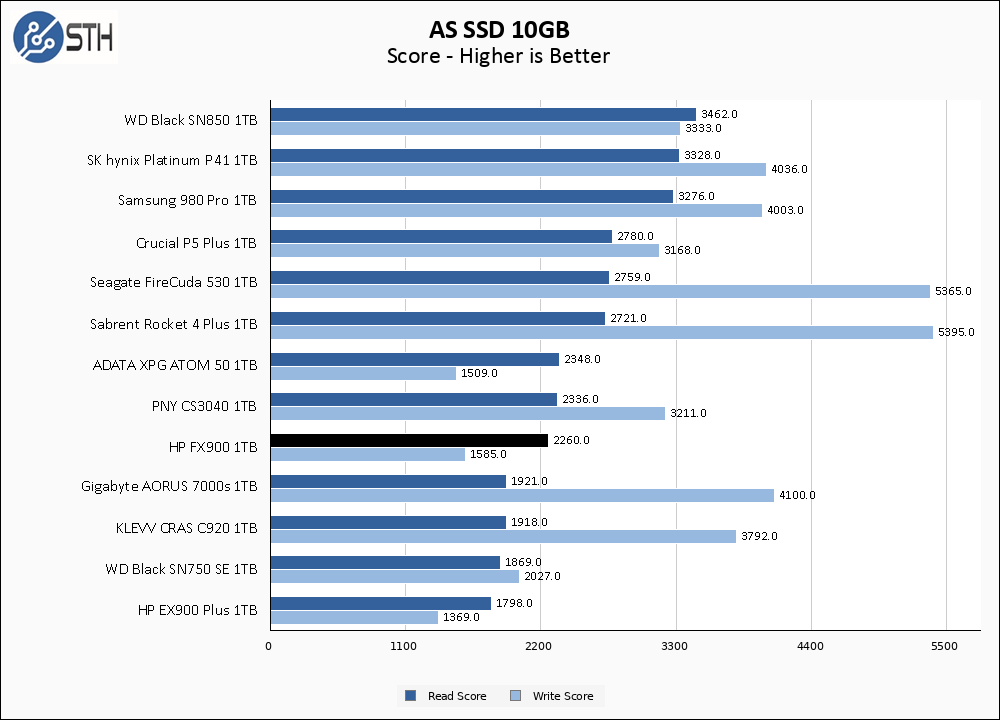
Thankfully the FX900 fares a bit better, relatively speaking, in the larger AS SSD test. Read score still suffers, but write score has moved up past several other PCIe 4.0 competitors.
SPECworkstation, thermals, and our conclusion are up next.


RE ” … the HP label is just a label … ” – I’m always peeling those off, just to get slightly better cooling. Maybe you can explore that idea one day?