AIDA64 Memory Test
AIDA64 memory bandwidth benchmarks (Memory Read, Memory Write, and Memory Copy) measure the maximum achievable memory data transfer bandwidth.
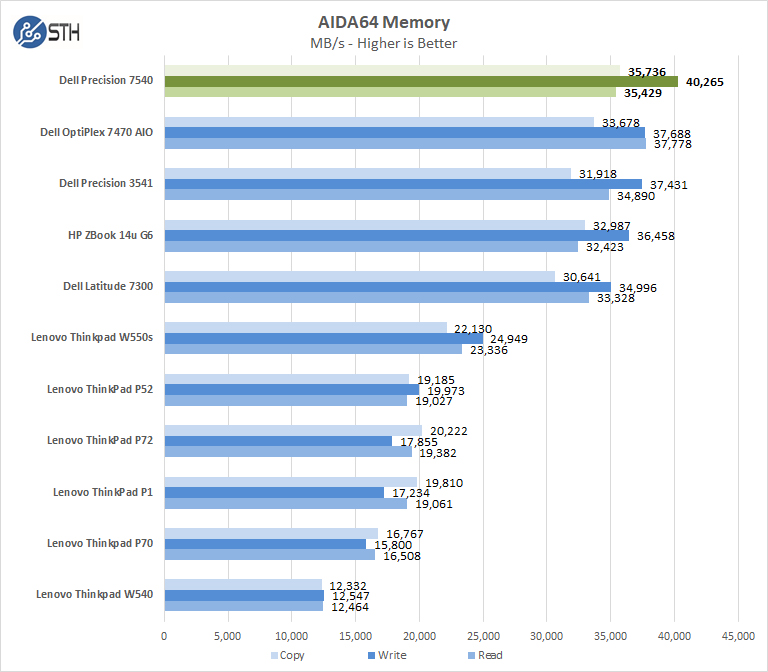
With 4x 8GB sticks of memory installed we see a much better performance. That brings the unit to the top of our results here.
AIDA64 GPGPU
These benchmarks are designed to measure GPGPU computing performance via different OpenCL workloads.
- Single-Precision FLOPS: Measures the classic MAD (Multiply-Addition) performance of the GPU, otherwise known as FLOPS (Floating-Point Operations Per Second), with single-precision (32-bit, “float”) floating-point data.
- Double-Precision FLOPS: Measures the classic MAD (Multiply-Addition) performance of the GPU, otherwise known as FLOPS (Floating-Point Operations Per Second), with double-precision (64-bit, “double”) floating-point data.
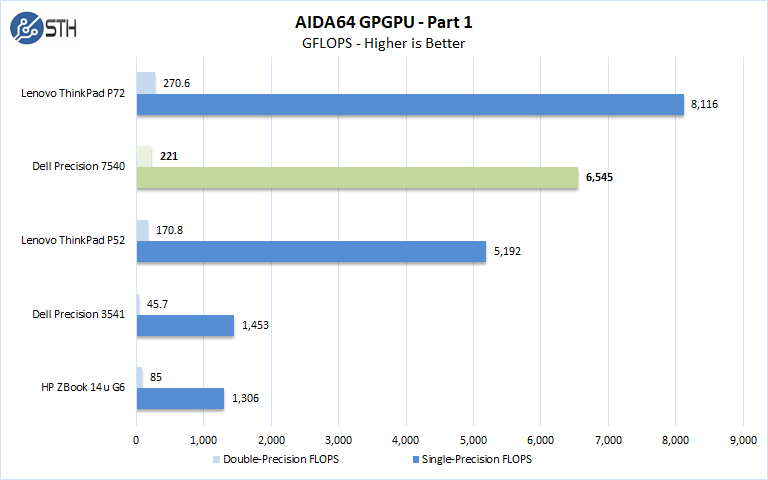
Here the Lenovo ThinkPad P72’s Quadro P5200 performs better in floating-point operations. This will change dramatically on the integer side.
The next set of benchmarks from AIDA64 are:
- 24-bit Integer IOPS: Measures the classic MAD (Multiply-Addition) performance of the GPU, otherwise known as IOPS (Integer Operations Per Second), with 24-bit integer (“int24”) data. This particular data type defined in OpenCL on the basis that many GPUs are capable of executing int24 operations via their floating-point units.
- 32-bit Integer IOPS: Measures the classic MAD (Multiply-Addition) performance of the GPU, otherwise known as IOPS (Integer Operations Per Second), with 32-bit integer (“int”) data.
- 64-bit Integer IOPS: Measures the classic MAD (Multiply-Addition) performance of the GPU, otherwise known as IOPS (Integer Operations Per Second), with 64-bit integer (“long”) data. Most GPUs do not have dedicated execution resources for 64-bit integer operations, so instead, they emulate the 64-bit integer operations via existing 32-bit integer execution units.
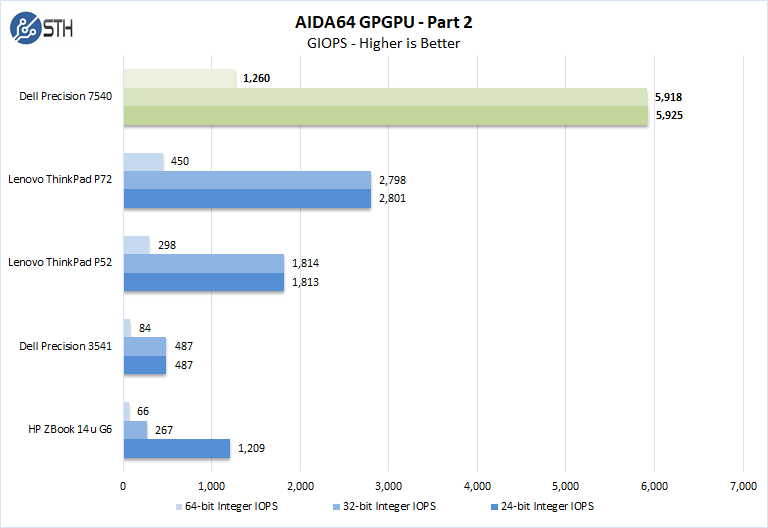
The NVIDIA Quadro RTX 3000 is clearly a top performer with our tests so far with almost double the performance of the Quadro P5200 found on the ThinkPad P72. The integer delta is much larger than the floating-point test deltas.
Cinebench R15
Cinebench is a real-world cross-platform test suite that evaluates your computer’s performance capabilities. The test scenario uses all of your system’s processing power to render a photorealistic 3D scene. This scene makes use of various algorithms to stress all available processor cores. You can also run this test with a single core mode to give a single-core rating.
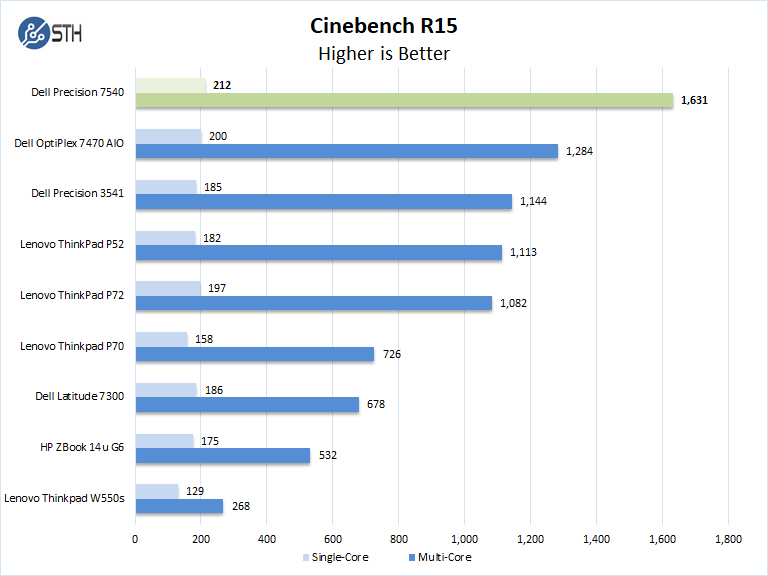
With eight fast cores, the Dell Precision 7540 is delivering multi-core performance well beyond what we are seeing from others in this test.
Geekbench 4
Geekbench 4 measures the compute performance of your GPU using image processing to computer vision to number crunching.
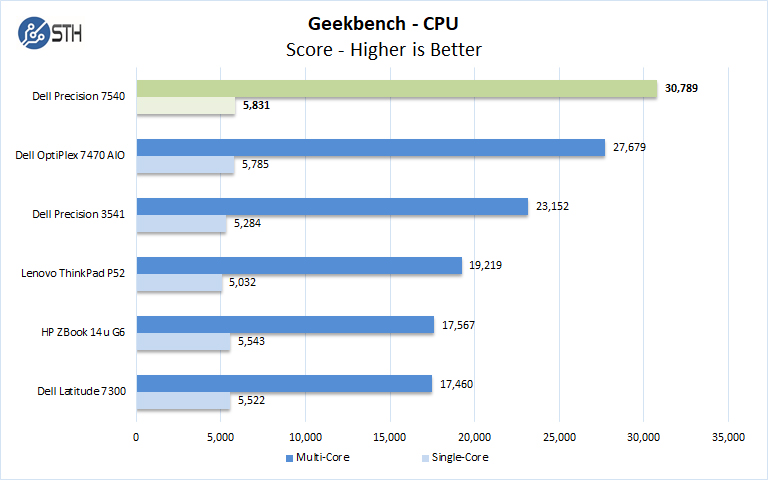
Geekbench shows better results for the Intel Core i9-9980HK which turbos up to 5GHz. While the single-threaded gains are appreciable but small, the multi-threaded performance gains are far greater.
LuxMark
LuxMark is an OpenCL benchmark tool based on LuxRender.
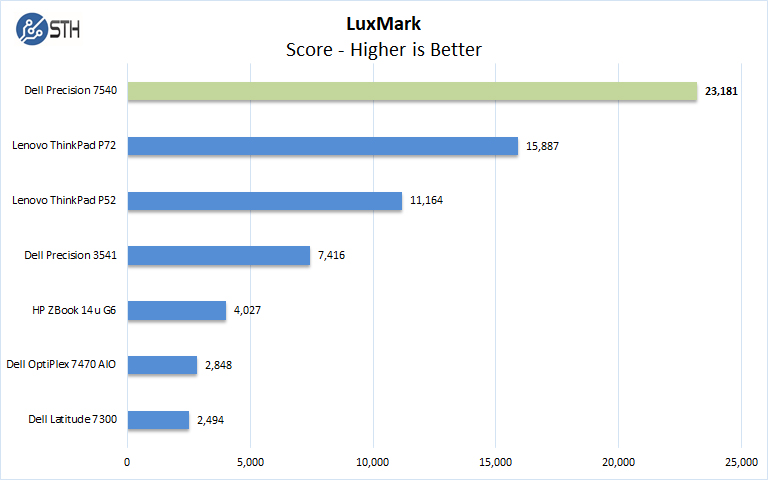
Here we see how the NVIDIA Quadro RTX 3000 GPU performs. For context, it is not comparable to higher-end desktop graphics with GPUs that would drain a notebook’s battery in a handful of minutes. In a mobile form factor, the NVIDIA Quadro RTX 3000 offers an impressive performance over previous generations.
Let us move on and start our testing with graphics-related benchmarks.


Nice review! Are you guys going to review the Precision 5540?
Nice! I like to hear about these newer gen mobile Precision workstations.
My 7710 with m5000m and Intel E3-1535M v5 (purchased Feb 2016) is still going strong however. Replaced the palm rest and keyboard under warranty and looks brand new again (a key cap broke off as I was swapping memory and the touchpad surface coating pealed – the touchpad coating on replacment parts is much better).