Dell EMC PowerEdge R7525 Performance
For this exercise, we are using our legacy Linux-Bench scripts which help us see cross-platform “least common denominator” results we have been using for years as well as several results from our updated Linux-Bench2 scripts.
At this point, our benchmarking sessions take days to run and we are generating well over a thousand data points. We are also running workloads for software companies that want to see how their software works on the latest hardware. As a result, this is a small sample of the data we are collecting and can share publicly. Our position is always that we are happy to provide some free data but we also have services to let companies run their own workloads in our lab, such as with our DemoEval service. What we do provide is an extremely controlled environment where we know every step is exactly the same and each run is done in a real-world data center, not a test bench.
We are going to show off a few results, and highlight a number of interesting data points in this article.
Python Linux 4.4.2 Kernel Compile Benchmark
This is one of the most requested benchmarks for STH over the past few years. The task was simple, we have a standard configuration file, the Linux 4.4.2 kernel from kernel.org, and make the standard auto-generated configuration utilizing every thread in the system. We are expressing results in terms of compiles per hour to make the results easier to read:
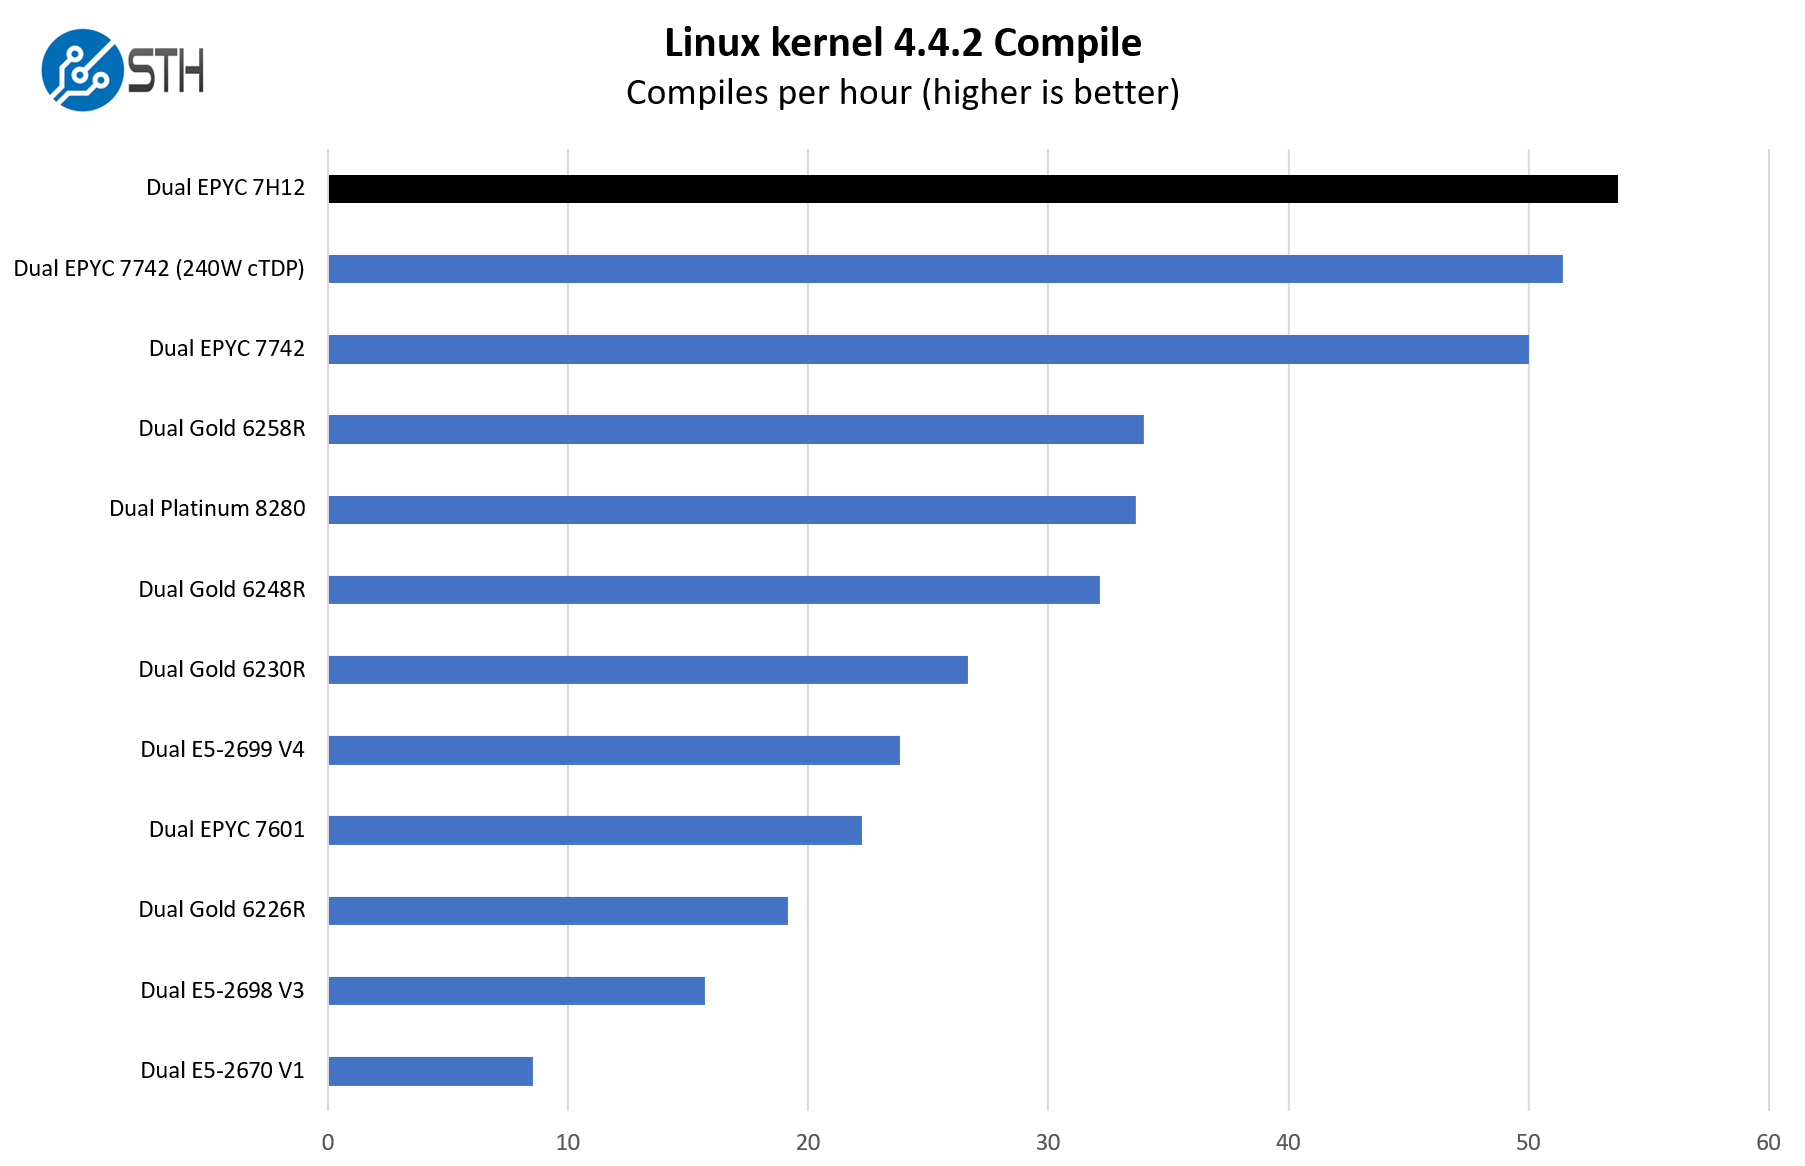
Here we can see the PowerEdge R7525 performs a bit better than the other offerings simply due to the ability to handle the AMD EPYC 7H12 SKUs. Also, we have a few results on this chart such as the dual Xeon E5-2670 (V1), E5-2698 V3, and E5-2699 V4 results just to give some sense of consolidation ratios. Even in a workload where we do not get as high of a Xeon to EPYC benefit, we are still seeing a 2.5:1 consolidation ratio even with top-end parts of those generations. If you have racks of PowerEdge R720 or PowerEdge R730 servers, the move to the R740 may be an incremental upgrade, but the R7525 is the type of upgrade where one gets a completely new class of performance.
c-ray 1.1 Performance
We have been using c-ray for our performance testing for years now. It is a ray tracing benchmark that is extremely popular to show differences in processors under multi-threaded workloads. We are going to use our 8K results which work well at this end of the performance spectrum.
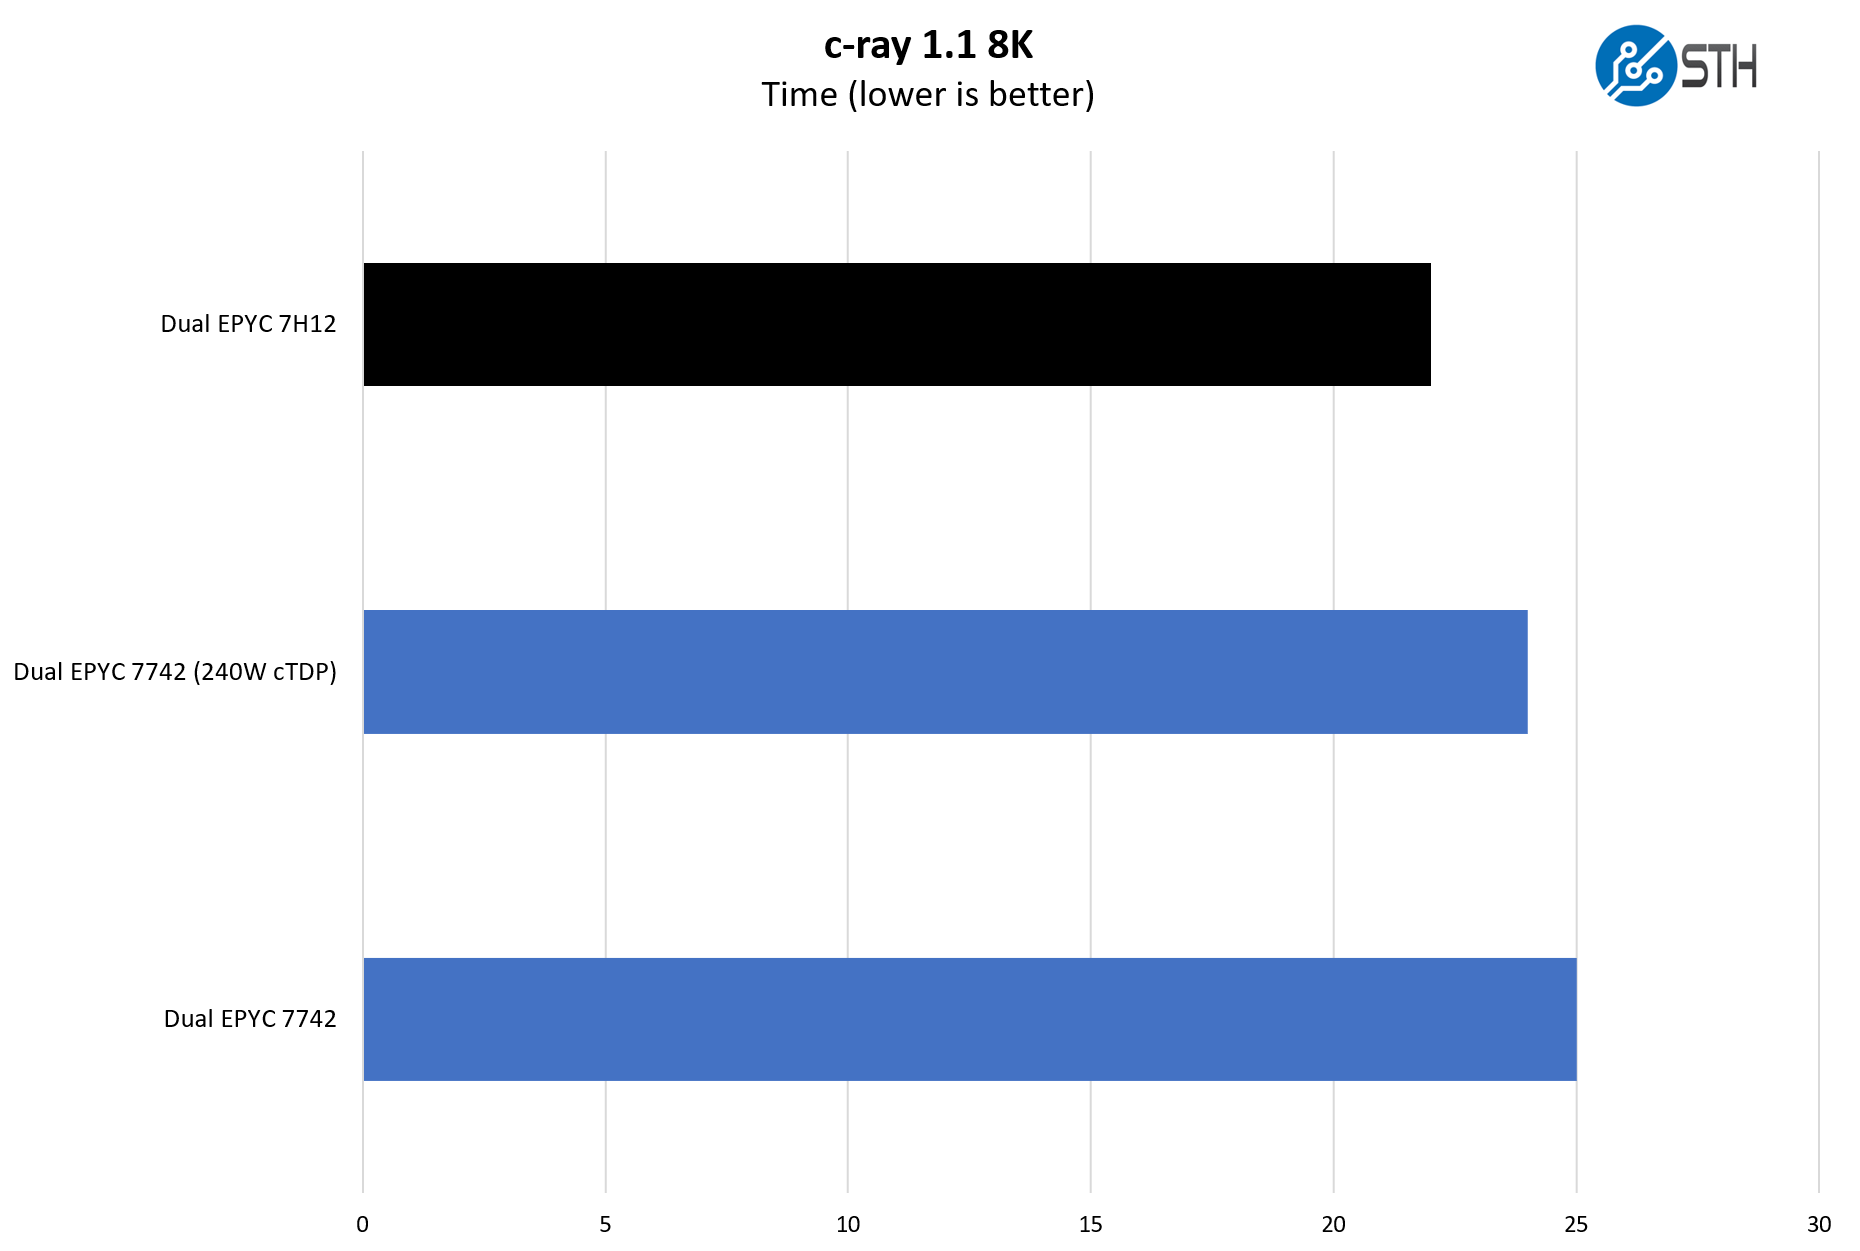
As a quick note here, some of the AMD EPYC CPUs have a configurable TDP. The EPYC 7742 is a good example of this and is a SKU that the PowerEdge R7525 can utilize as well. In competitive benchmarking this is often used at a 225W TDP instead of the full 240W cTDP. In the PowerEdge R7525, the system can cool up to 280W TDP parts so we can take advantage of this extra headroom. That is not true on all dual-socket AMD EPYC platforms, so it is a differentiator for the R7525.
7-zip Compression Performance
7-zip is a widely used compression/ decompression program that works cross-platform. We started using the program during our early days with Windows testing. It is now part of Linux-Bench.
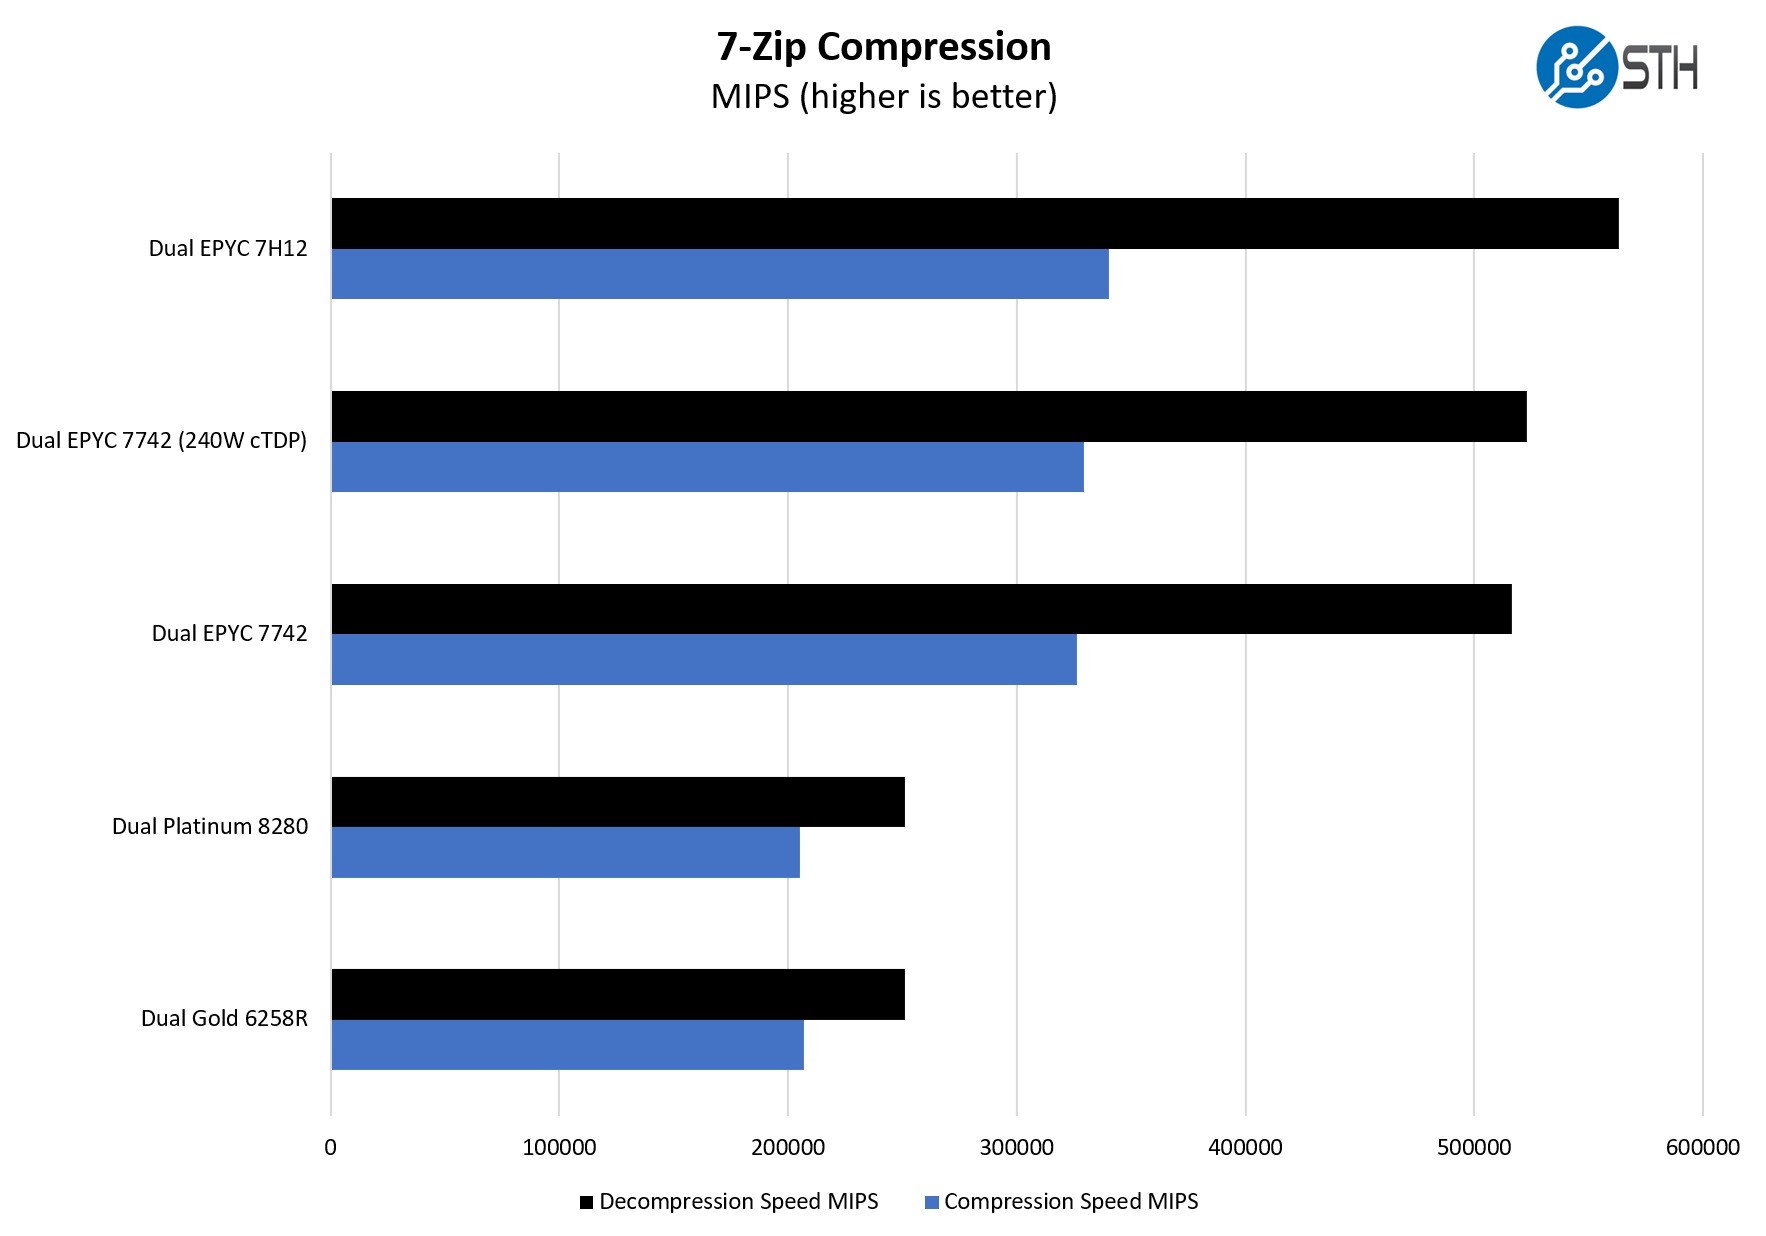
Taking a step back, when we look at 2nd Generation Intel Xeon Scalable performance, we see the 64-core AMD EPYC CPUs are much higher. The Platinum 8280 is a modest upgrade over the first-gen Platinum 8280. The Xeon Gold 6258R is a similar chip with only dual socket-to-socket UPI links and about a 60% discount as a response to the AMD EPYC 7002 series.
OpenSSL Performance
OpenSSL is widely used to secure communications between servers. This is an important protocol in many server stacks. We first look at our sign tests:
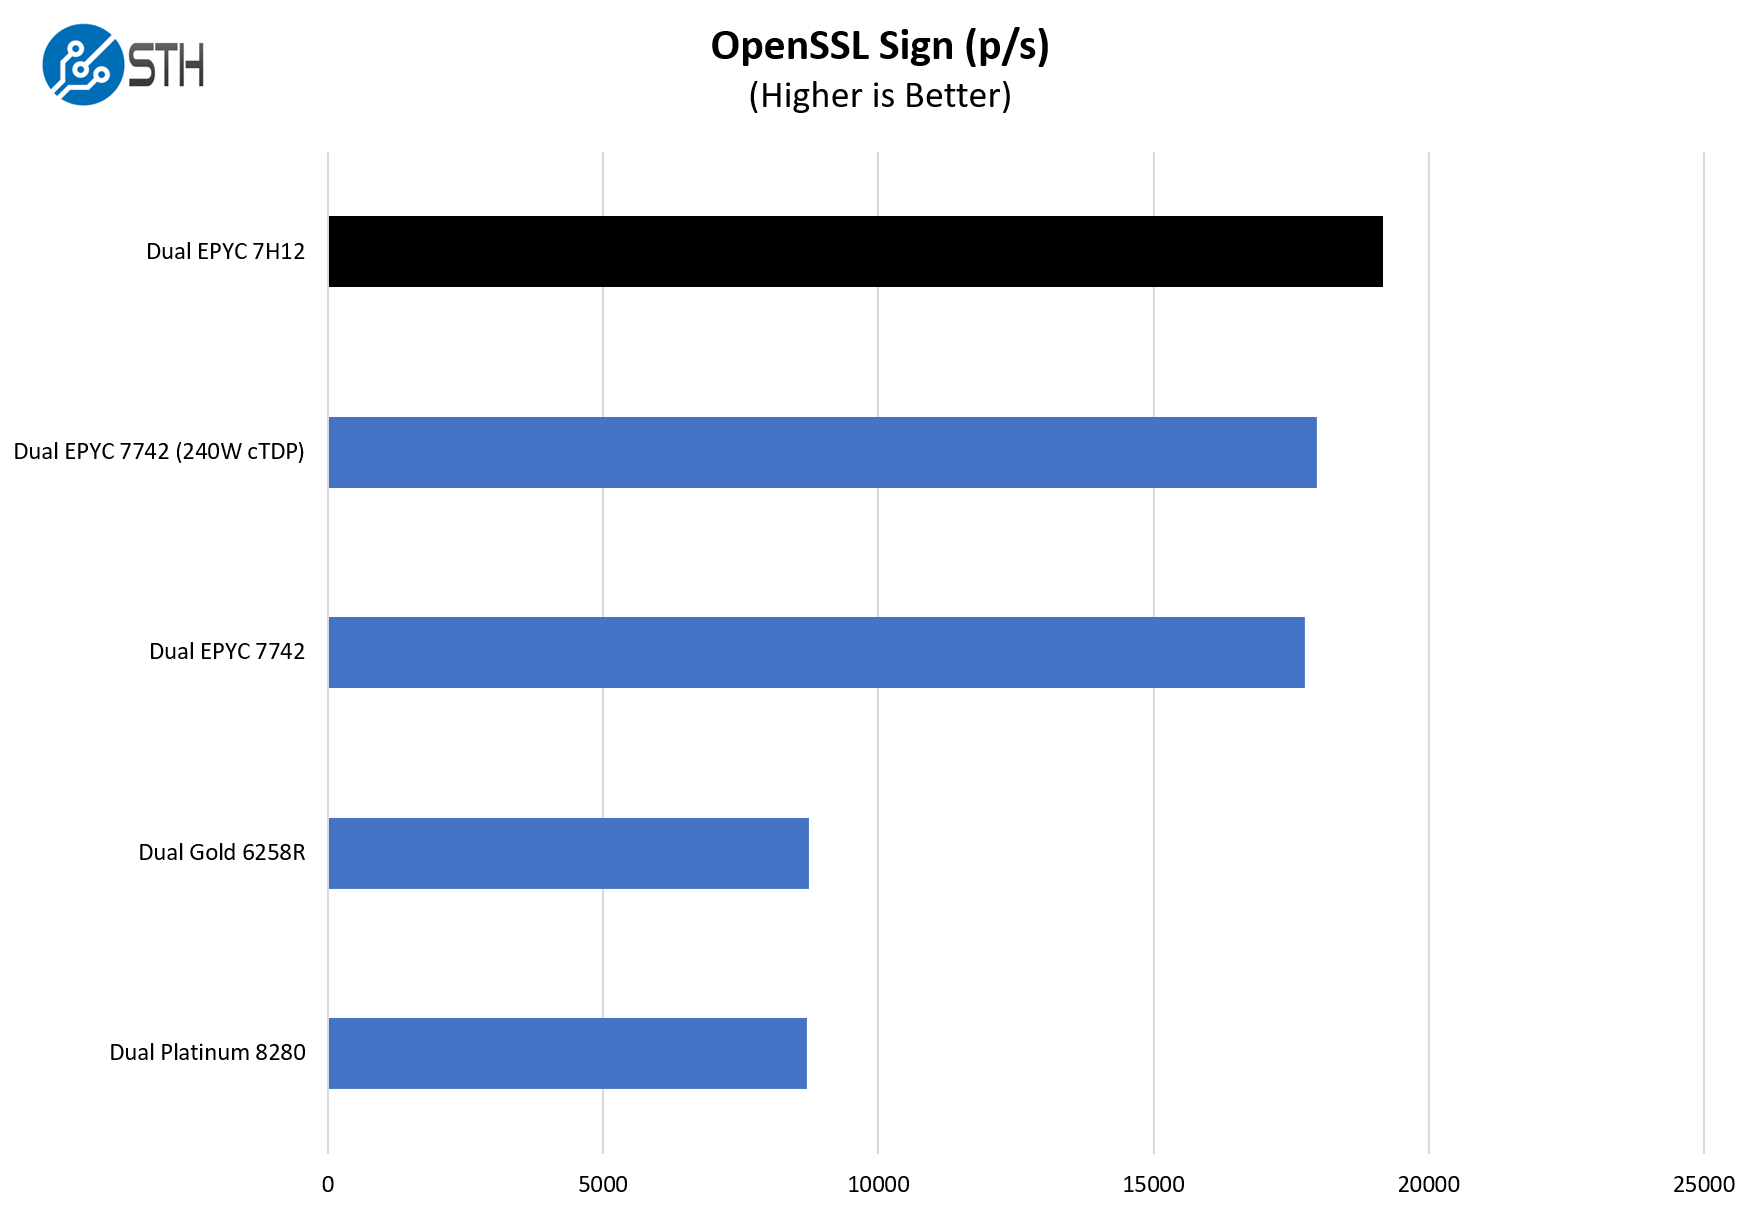
Here are the verify results:
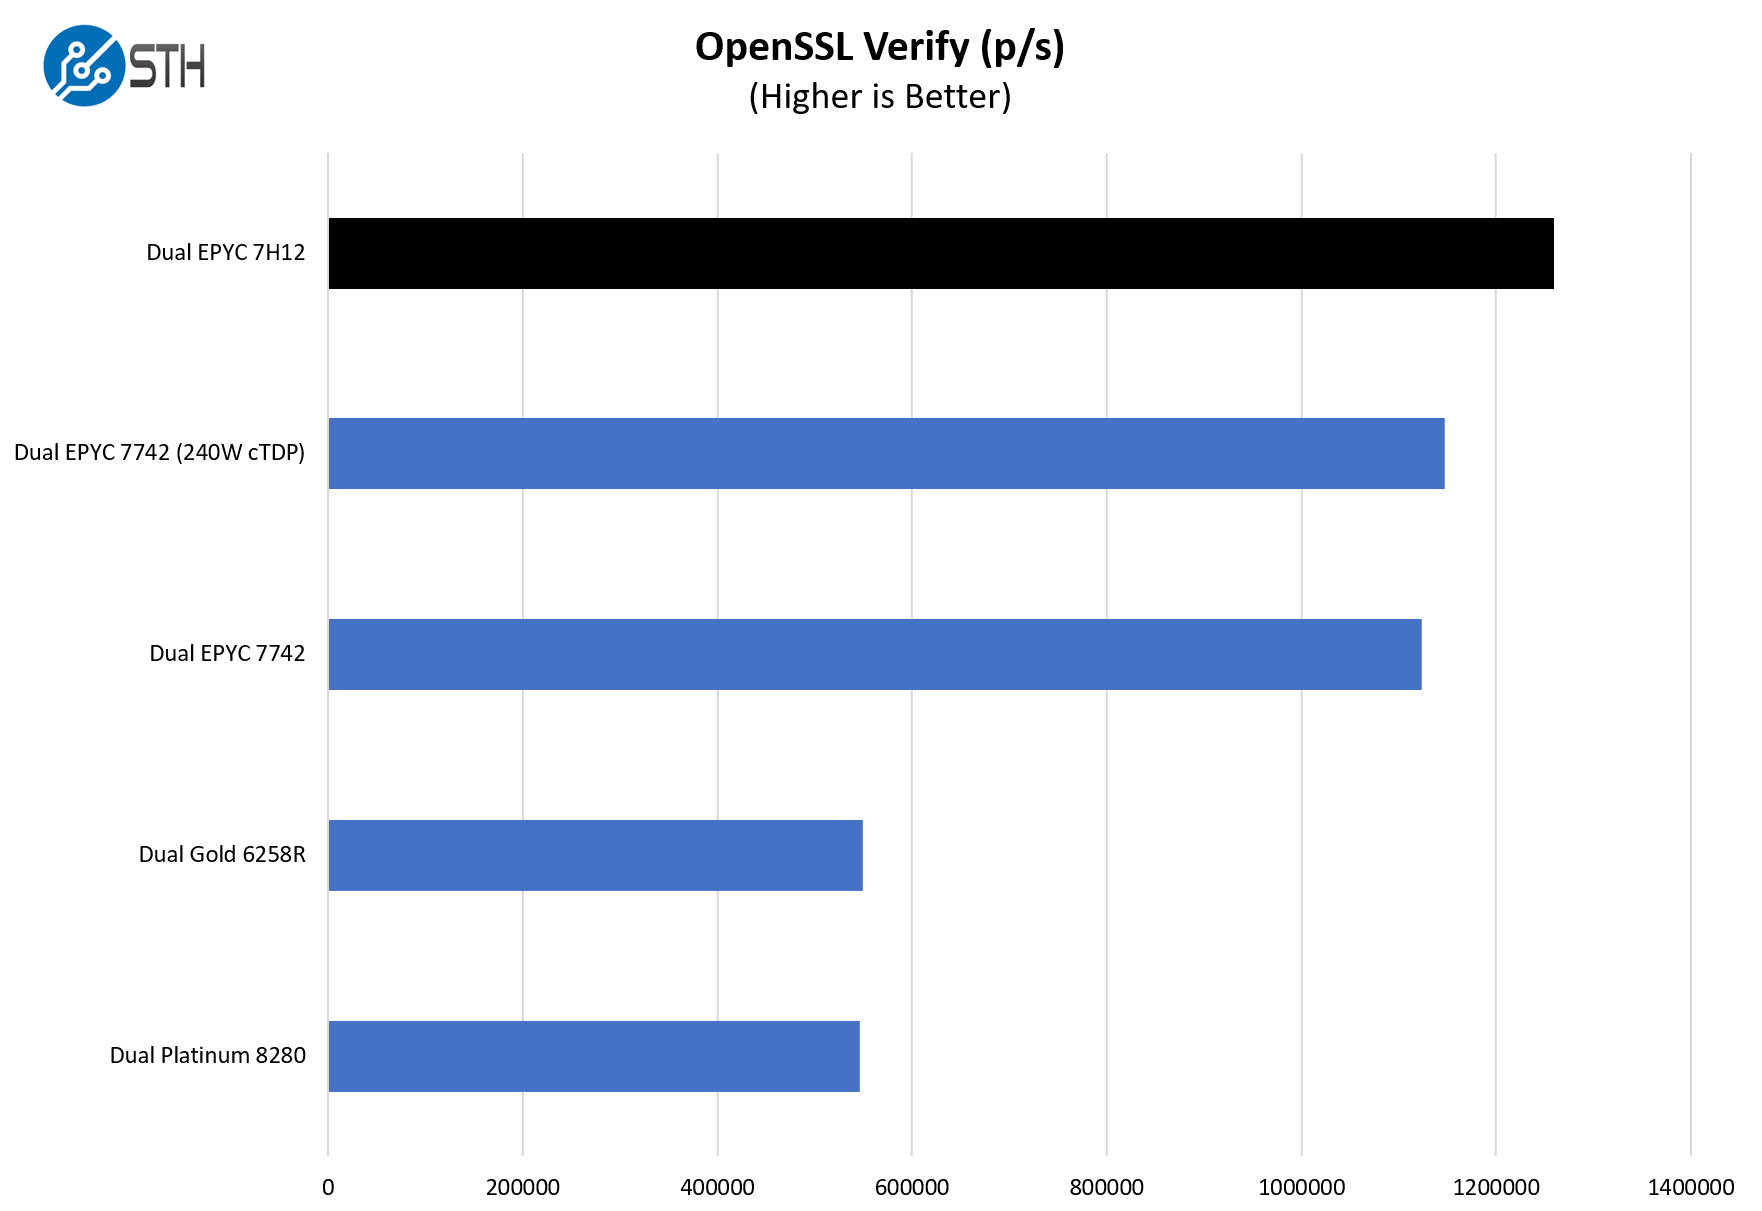
If you are coming from a PowerEdge R740, the 32, 48, and 64-core AMD EPYC 7002 parts offer more per-socket and per-server performance than the dual-socket 28 core Skylake/ Cascade Lake Xeon Scalable systems.
Chess Benchmarking
Chess is an interesting use case since it has almost unlimited complexity. Over the years, we have received a number of requests to bring back chess benchmarking. We have been profiling systems and are ready to start sharing results:
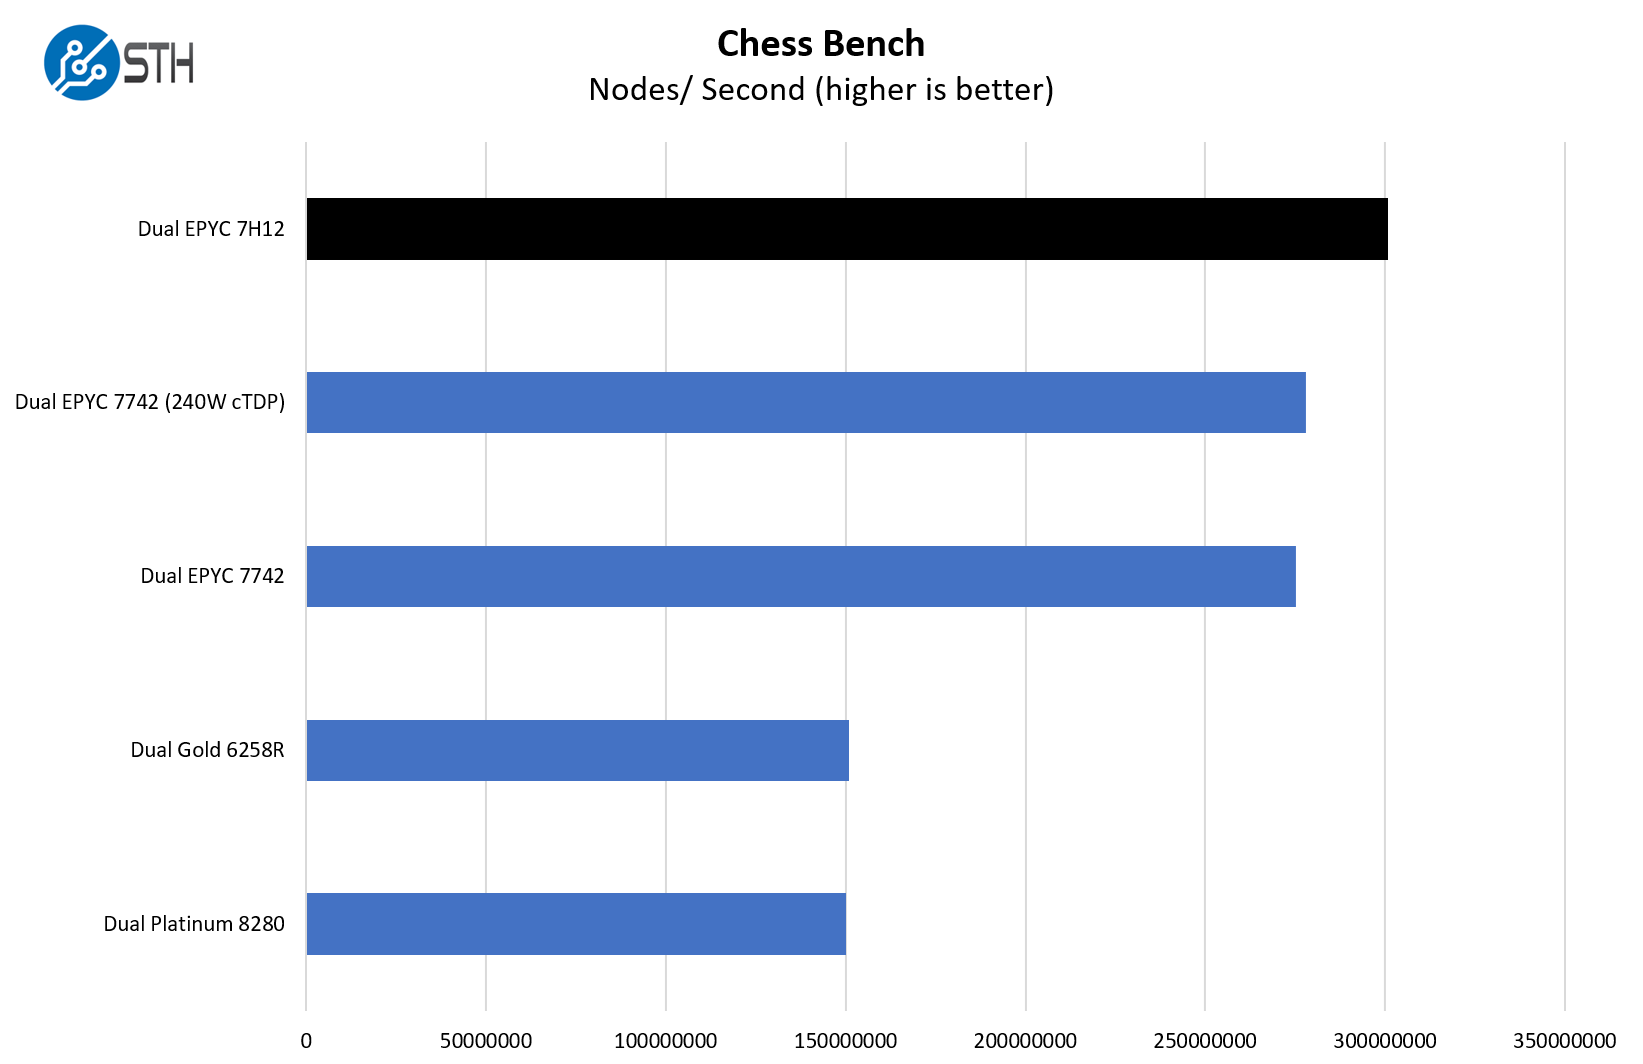
We are not showing these here, but one can see that AMD also has frequency optimized parts we covered in the AMD EPYC 7F52 Benchmarks Review and Market Perspective. We realize we are focused on per-socket rather than per-core performance. That is a function of the 64-core CPUs we had and the PSB function limiting our willingness to swap lab CPUs into these systems.
STH STFB KVM Virtualization Testing
One of the other workloads we wanted to share is from one of our DemoEval customers. We have permission to publish the results, but the application itself being tested is closed source. This is a KVM virtualization-based workload where our client is testing how many VMs it can have online at a given time while completing work under the target SLA. Each VM is a self-contained worker.
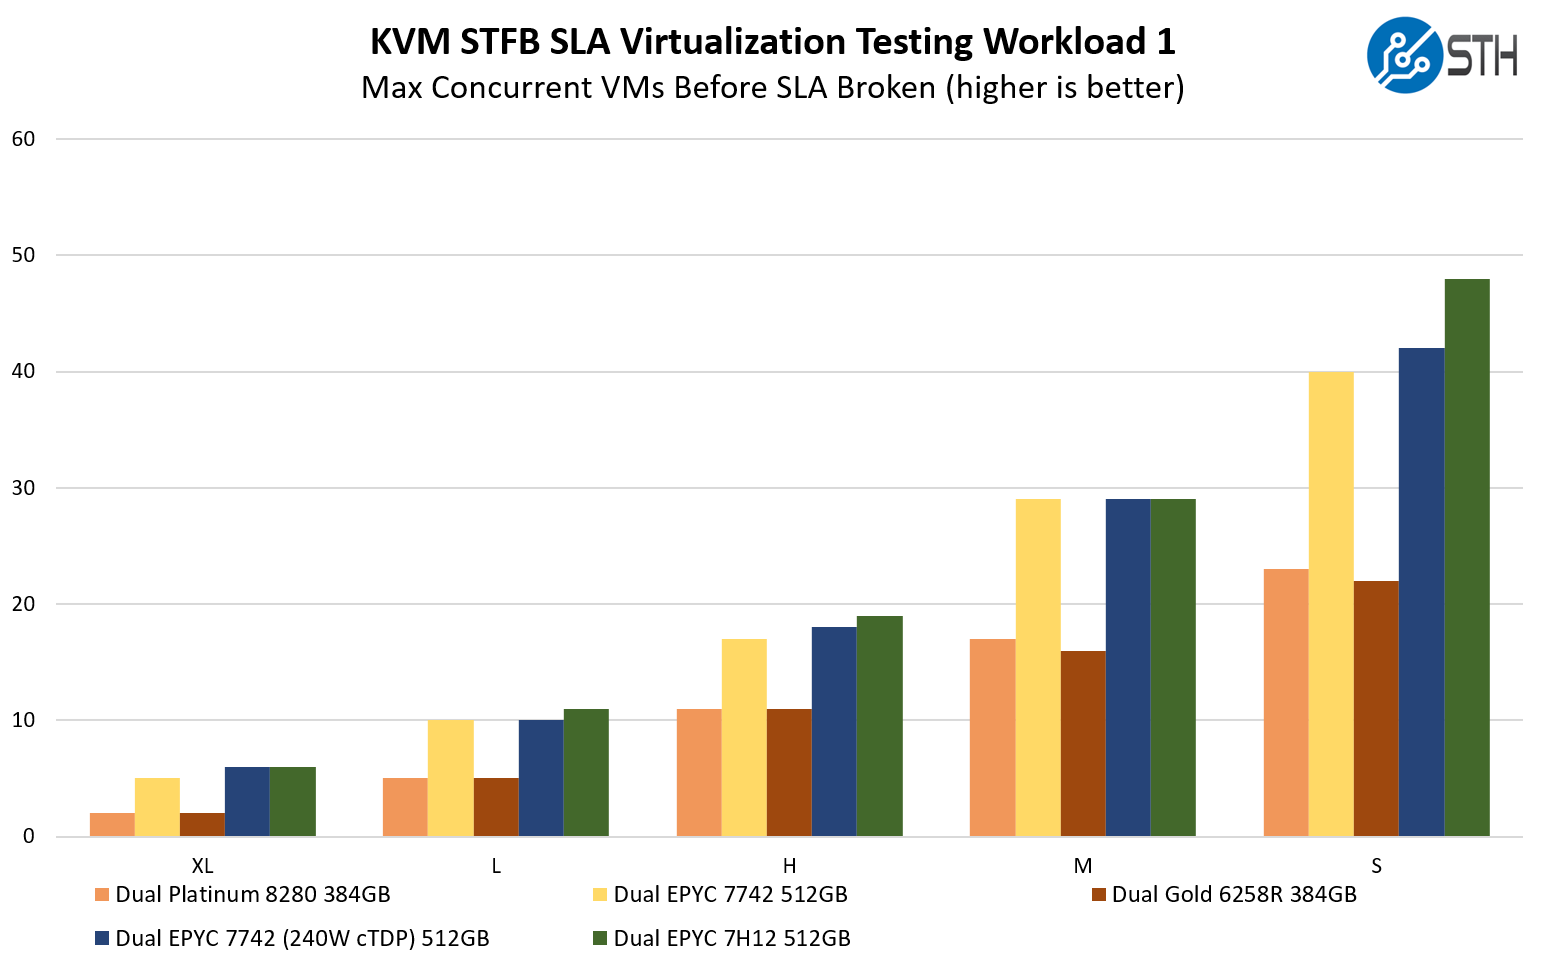
In our virtualization testing, we get a similar result to our other charts. While the Xeon CPUs can utilize Intel Optane PMem to get greater memory capacity (except Cooper Lake-based 3rd gen systems), the EPYC 7002 series can hit 1TB of memory capacity using commodity 64GB DDR4 RDIMMs and go beyond that without needing specialized L-SKUs.
Next, we are going to discuss power consumption, followed by our final thoughts.


Speaking of course as an analytic database nut, I wonder this: Has anyone done iometer-style IO saturation testing of the AMD EPYC CPUs? I really wonder how many PCIe4 NVMe drives a pair of EPYC CPUs can push to their full read throughput.
I should have first said this: I want a few of these!!!
Patrick, I’m curious when you think we’ll start seeing common availability of U.3 across systems and storage manufacturers? Are we wasting money buying NVMe backplanes if U.3 is just around the corner? Perhaps it’s farther off than I think? Or will U.3 be more niche and geared towards tiered storage?
I see all these fantastic NVMe systems and wonder if two years from now I’ll wish I waited for U.3 backplanes.
The only thing I don’t like about the R7525s (and we have about 20 in our lab) is the riser configuration with 24x NVMe drives. The only x16 slots are the two half-height slots on the bottom. I’d prefer to get two full height x16 slots, especially now that we’re seeing more full height cards like the NVIDIA Bluefield adapters.
We’re looking at these for work. Thanks for the review. This is very helpful. I’ll send to our procurement team
This is the prelude to the next generation ultra-high density platforms with E1.S and E1.L and their PCIe Gen4 successors. AMD will really shine in this sphere as well.
We would set up two pNICs in this configuration:
Mellanox/NVIDIA ConnectX-6 100GbE Dual-Port OCPv3
Mellanox/NVIDIA ConnectX-t 100GbE Dual-Port PCIe Gen4 x16
Dual Mellanox/NVIDIA 100GbE switches (two data planes) configured for RoCEv2
With 400GbE aggregate in an HCI platform we’d see huge IOPS/Throughput performance with ultra-low latency across the board.
The 160 PCIe Gen4 peripheral facing lanes is one of the smartest and most innovative moves AMD made. 24 switchless NVMe drives with room for 400GbE of redundant ultra-low latency network bandwidth is nothing short of awesome.
Excellent article Patrick!
Happy New Year to everyone at Serve The Home! :)
> This is a forward-looking feature since we are planning for higher TDP processors in the near future.
*cough* Them thar’s a hint. *cough*
Dear Wes,
This is focused towards the data IO for NAS/Databases/Websites. If you want full height x16 slots for AI, GPGPU or VM’s with vGPU then you’ll have to look elsewhere for larger cases. You could still use the R7525 to host the storage & non-GPU apps.
@tygrus
There are full height storage cards (think computational storage devices) and full height Smart NICs (like the Nvidia Bluefield-2 dual port 100Gb NIC) that are extremely useful in systems with 24x NVMe devices. These are still single slot cards, not a dual slot like GPUs and accelerators. I’m also only discussing half length cards, not full length like GPUs and some other accelerators.
The 7525 today supports 2x HHHL x16 slots and 4x FHHL x8 slots. I think the lanes should have been shuffled on the risers a bit so that the x16 slots are FHHL and the HHHL slots are x8.
@Wes
Actually R7525 can be configured also with Riser config allowing full length configuration (on my configurator I see Riser Config 3 allow that). I see that both when using SAS/SATA/Nvme and when using NVME only. I also see that on DELL US configurator NVME only configuration does not allow Riser Config 3. Looking at Technical manual, I see that such configuration is not allowed while looking on at the Installation and Service Manual such configuration is listed in several parts of the manual. Take a look.
I configured mine with the 16 x NVMe backplane for my lab. 3 x Optane and 12 by NVMe drives. 1 cache + 4 capacity, 3 disk groups per server. I then have 5 x16 full-length slots. 2 x Mellanox 100Gbe adapters, plus the OCP NIC and 2 x Quadro RTX8000 across 4 servers. Can’t wait to put them into service.
Hey There, what’s the brand to chipset?
Hi, can I ask the operational wattage of DELL R7525?
I can’t seem to find any way to make the dell configurator allow me to build an R7525 with 24x NVMe on their web site. Does anyone happen to know how/where I would go about building a machine with the configurations mentioned in this article?