ASUS TUF Gaming GeForce RTX 4090 OC Edition Compute Benchmarks
It has been several years now since we have done a desktop graphics card review. As a result, many of the benchmarks we used before have been updated to newer versions or do not exist anymore, or require a new license. We wanted to see the progression of the older benchmarks. However, soon those will be dropped off and we just show the latest results of the new graphics card as we start our new 2023 performance test reviews. We have redesigned the suite for 2023. This card will be included in the new suite, and we will back-test a portion of the older generation(s) to give some reference.
For now, we are going to compare the ASUS ROG Strix GeForce RTX 4090 OC offering to our growing GPU data set using the older data and adding in new and updated benchmarks. The Strix review was effectively be the endpoint of our old dataset, and we will have an updated set in the future.
We added an ASUS ROG Strix 3090 OC to reference the last gen graphics cards. As time passes, we hope to add more to benchmarks into the new data set.
Geekbench 5 and 6
Geekbench 4 and 5 measure the compute performance of your GPU using image processing computer vision to number crunching.
The top result is Geekbench 5, while all below are from Geekbench 5 runs.
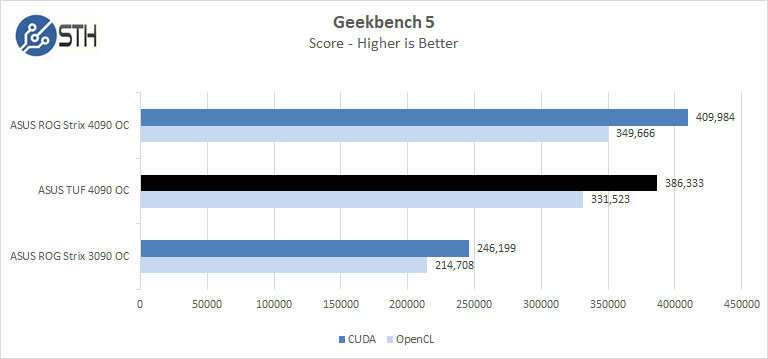
Geekbench 6 was just released a few days ago. It does not include CUDA benchmarks which I hope they bring back. Instead, they use OpenCL and Vulkan.
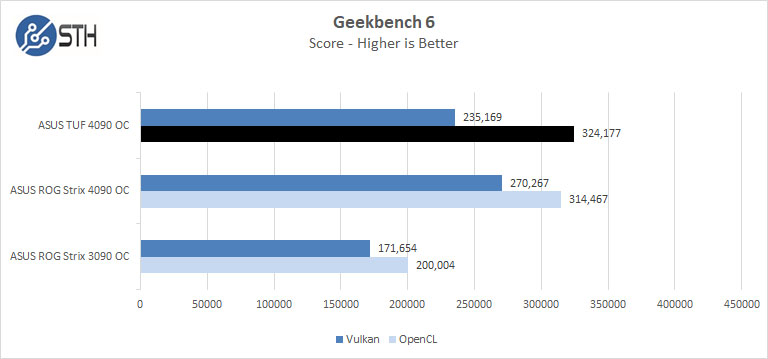
These benchmarks show the two 4090’s trading blows between Geekbench 5 and 6.
LuxMark
LuxMark is an OpenCL benchmark tool based on LuxRender.
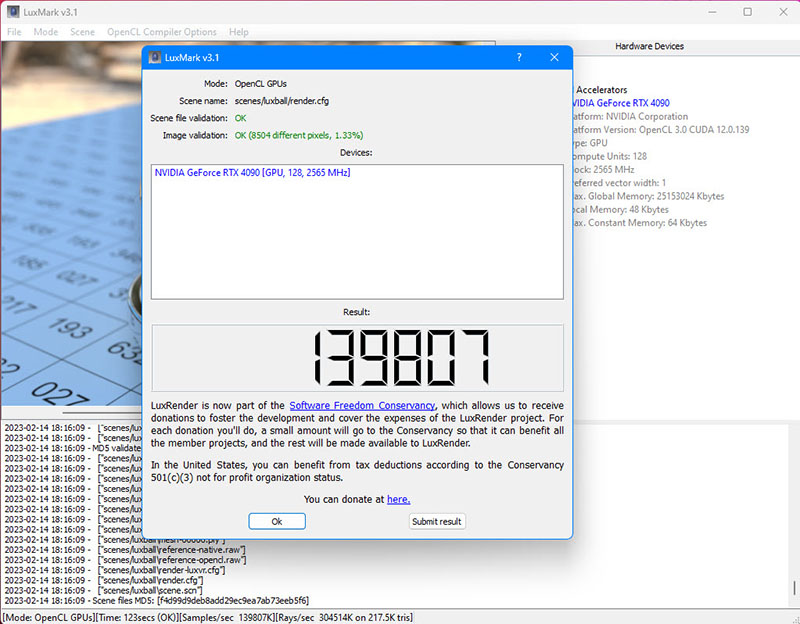
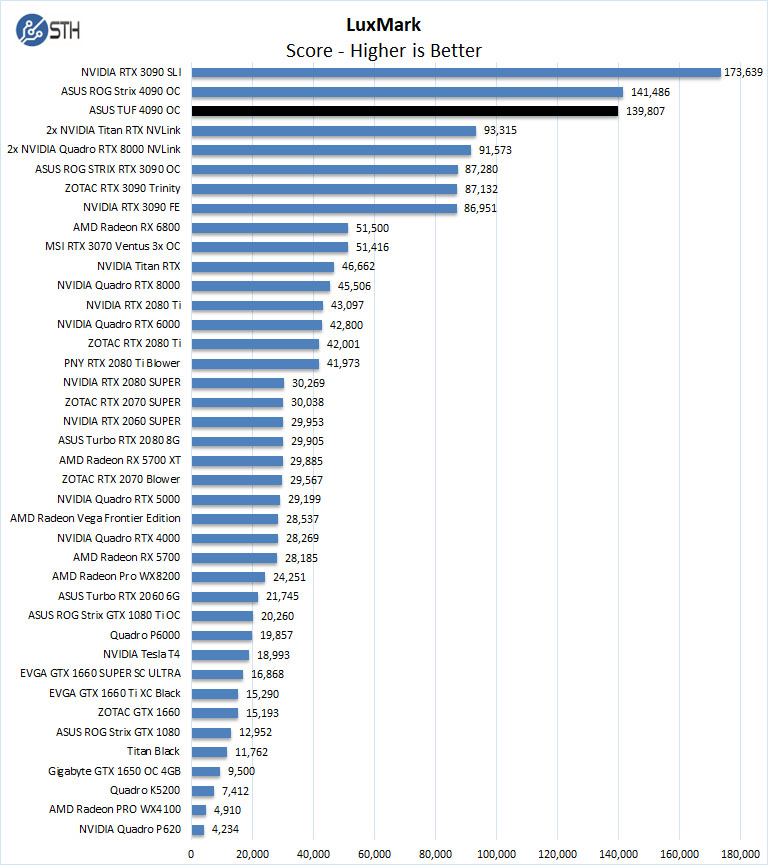
Both the TUF and Strix are neck and neck in LuxMark.
AIDA64 GPGPU
These benchmarks are designed to measure GPGPU computing performance via different OpenCL workloads.
- Single-Precision FLOPS: Measures the classic MAD (Multiply-Addition) performance of the GPU, otherwise known as FLOPS (Floating-Point Operations Per Second), with single-precision (32-bit, “float”) floating-point data.
- Double-Precision FLOPS: Measures the classic MAD (Multiply-Addition) performance of the GPU, otherwise known as FLOPS (Floating-Point Operations Per Second), with double-precision (64-bit, “double”) floating-point data.
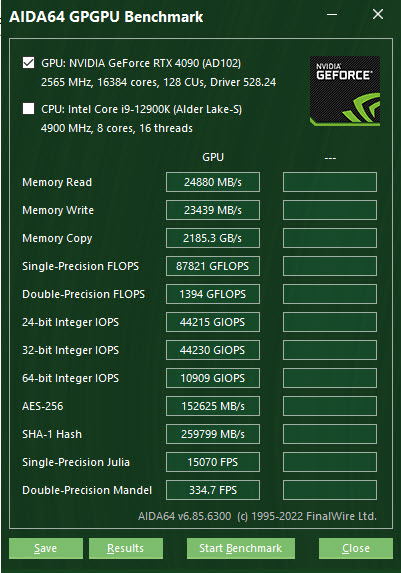
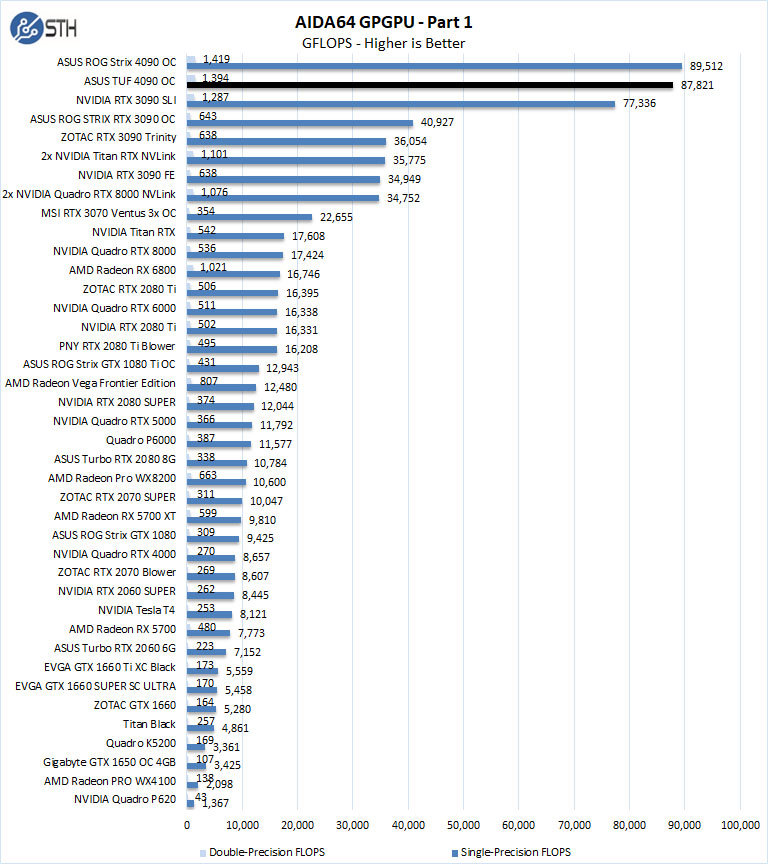
The next set of benchmarks from AIDA64 are:
- 24-bit Integer IOPS: Measures the classic MAD (Multiply-Addition) performance of the GPU, otherwise known as IOPS (Integer Operations Per Second), with 24-bit integer (“int24”) data. This particular data type defined in OpenCL on the basis that many GPUs are capable of executing int24 operations via their floating-point units.
- 32-bit Integer IOPS: Measures the classic MAD (Multiply-Addition) performance of the GPU, otherwise known as IOPS (Integer Operations Per Second), with 32-bit integer (“int”) data.
- 64-bit Integer IOPS: Measures the classic MAD (Multiply-Addition) performance of the GPU, otherwise known as IOPS (Integer Operations Per Second), with 64-bit integer (“long”) data. Most GPUs do not have dedicated execution resources for 64-bit integer operations, so instead, they emulate the 64-bit integer operations via existing 32-bit integer execution units.
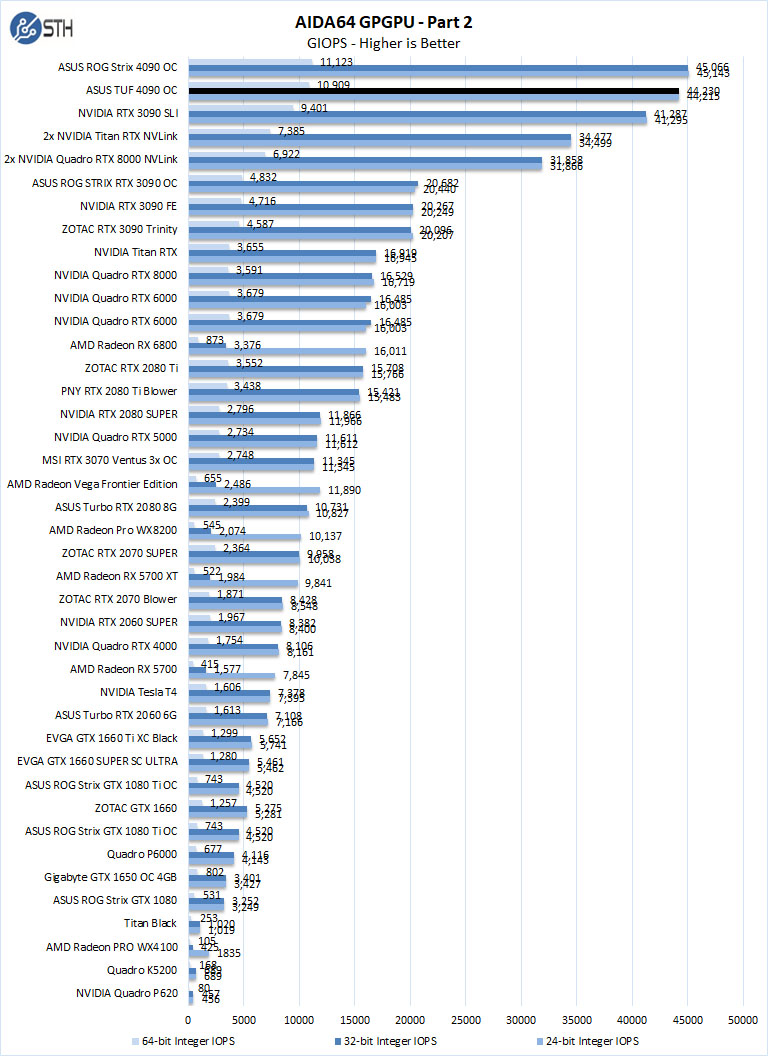
Again, both cards are neck and neck with a slight lead with the Strix version.
hashcat64
hashcat64 is a password-cracking benchmark that can run many different algorithms. We used the windows version and a simple command of hashcat64 -b. Out of these results, we used five results in the graph.
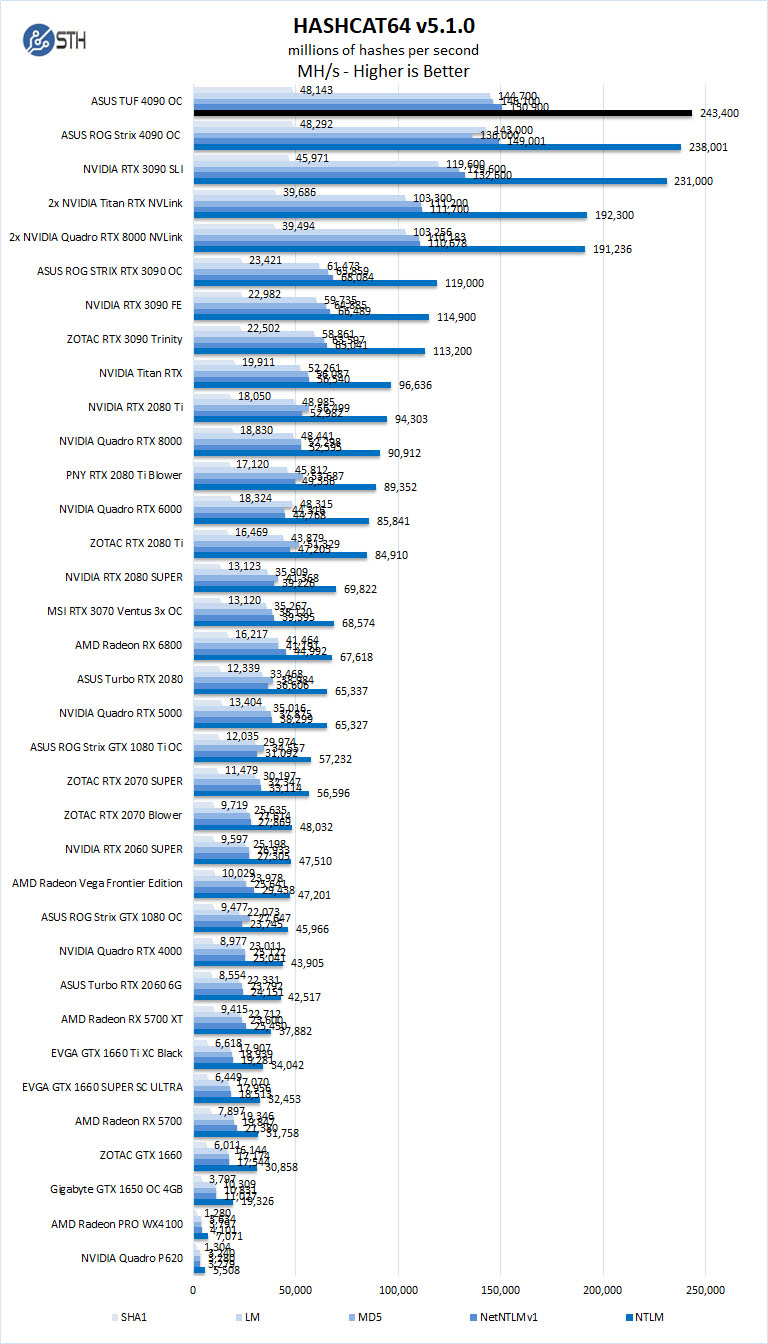
With hashcat64 the TUF takes a slight lead.
GPUPI
GPUPI calculates the mathematical constant Pi in parallel by using the BPP formula and optimizing it for OpenCL and CUDA-capable devices like graphics cards and main processors.
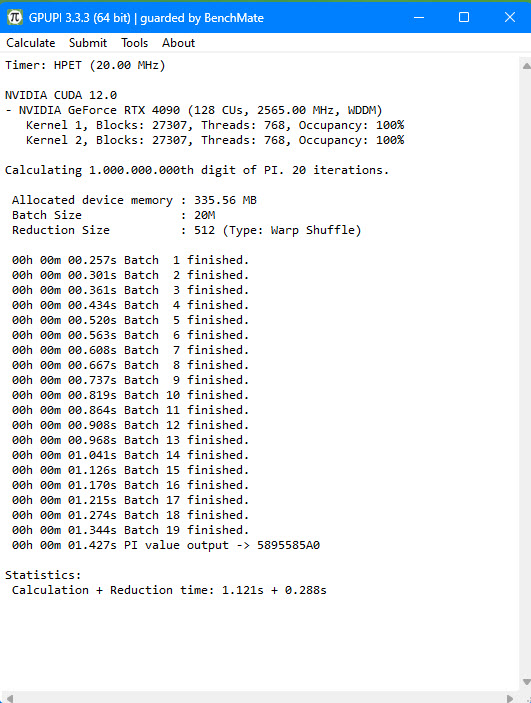
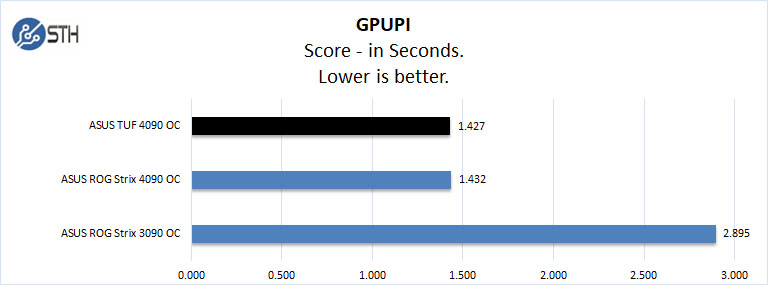
The ASUS ROG Strix 4090 OC completes this task in 1.431 seconds, while the TUF falls slightly faster at 1.427. We were able to also add the RTX 3090 in here compared to when we did the RTX 4090 Strix review.
Next, we will look at SPECviewperf 2020 performance tests.



Soon the PC form factor will need to change: the mobo will be installed in a slot in the nVidia GPU.