This week, Ampere made a number of announcements regarding its AmpereOne line. We previously covered Ampere AmpereOne Pricing and SKU List, as well as the forthcoming Ampere AmpereOne Aurora 512 Core AI CPU. Another part of the announcement was the AmpereOne performance, and we figured we would get into that a bit next.
Ampere AmpereOne 192 Core Performance Outlined
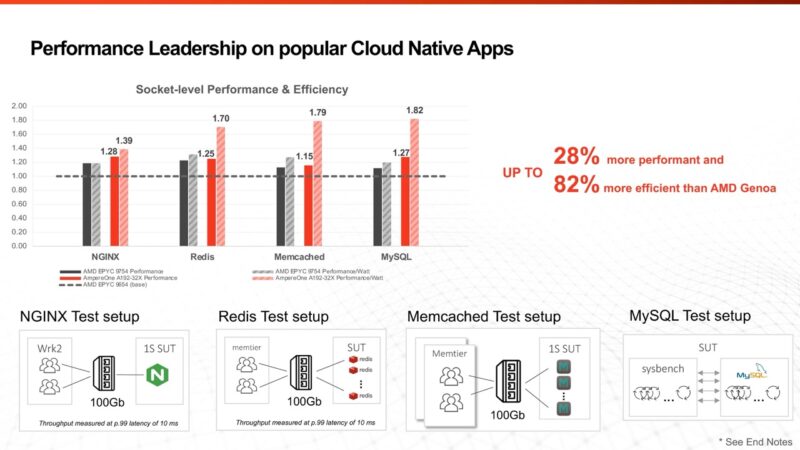
Taking a look at Ampere’s performance deck, it says its servers cost less, use less power, and have more performance. We are going to look at the end notes later in this piece.
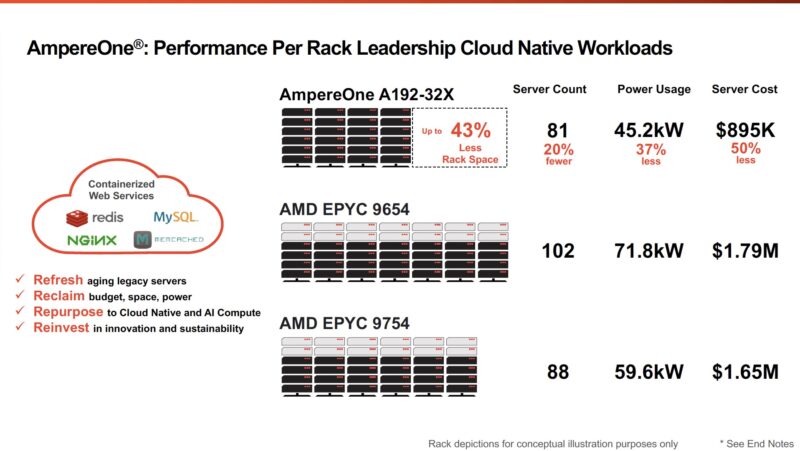
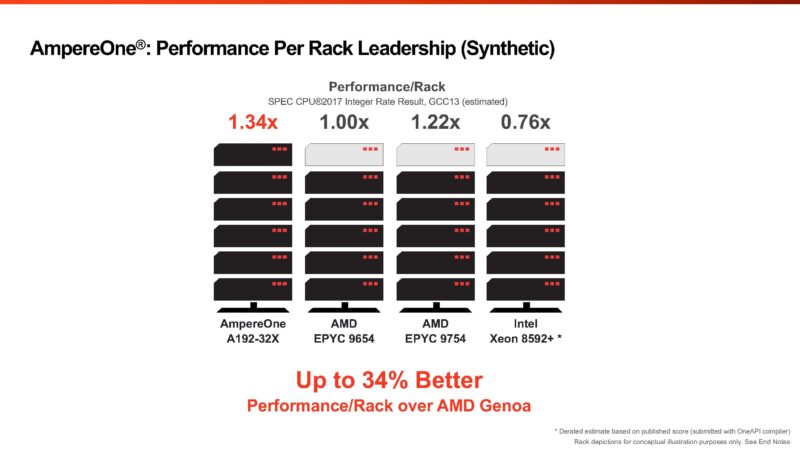
The above uses a containerized web stack, which is mostly based on integer workloads. Ampere also has this slide saying it has better performance per rack than AMD and Intel. We will quickly note that it is using a 5th Gen Xeon based on P-cores instead of the newer Xeon 6 E-core “Sierra Forest” CPUs here. Still, AmpereOne is said to offer better performance per rack.
This is perhaps the coolest slide. The AMD EPYC versus AmpereOne on a performance-per-watt basis. We will note here that Ampere seems to say they have a 694 estimated SPEC CPU2017 Integer Rate score based on the bar while using only 274W.
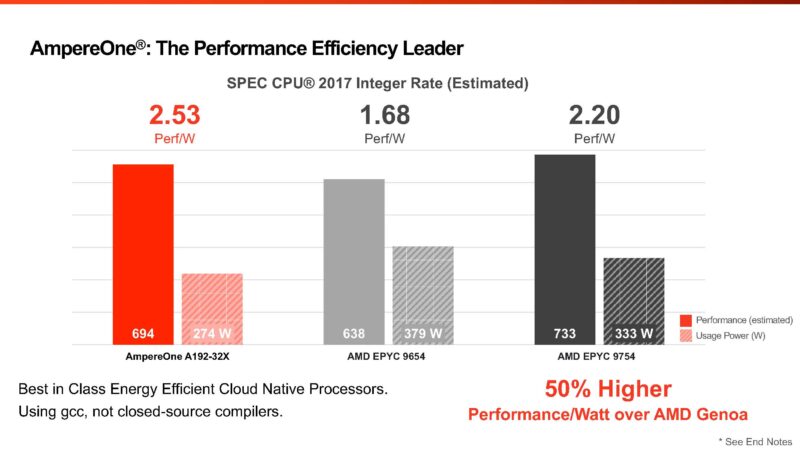
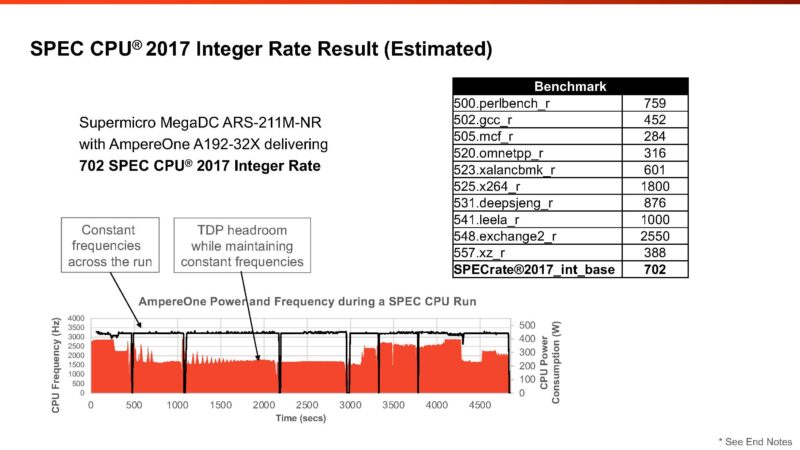
On the next slide, the score has jumped to 694. This 8 in score difference might just be a small power tweak between the runs. Ampere told us that they are submitting an official result to Spec.org, so we hope it is the 702, not the 694. Something interesting is that the EPYC 9754 above at 333W average is below the standard TDP of 360W. The EPYC 9754 is also known for getting much higher efficiency when the TDP is decreased. Still, it is an interesting data point. If that 733 score feels low since we often see ~950-1000 for the AMD EPYC 9754, the reason is that Ampere is not using AOCC, and instead is using GCC 13 for all CPUs.
To be sure, GCC is a huge ecosystem, and one valid way to look at performance is to remove compiler differences. Others will argue that the presence of better compilers gives AMD and Intel an unfair advantage. Notably, when we look at the GPU side, using things like CUDA and NVIDIA tools is standard for NVIDIA GPUs. Likewise, other AI accelerators use their own tools. Over the years, I have generally liked presenting our results using GCC, but on specific benchmarks, like SPEC CPU2017, the compiler is the best available. It feels strange, but I have been drifting more towards the idea of using optimized compilers based on the standards we see in the GPU space. After all, NVIDIA’s data center GPUs are now the dominant revenue chip in data centers. It now feels strange to apply different standards to CPUs which are “niche” computing (by revenue).
Ampere claims a modest victory over AMD EPYC Bergamo in some cases but a significant performance-per-watt advantage.
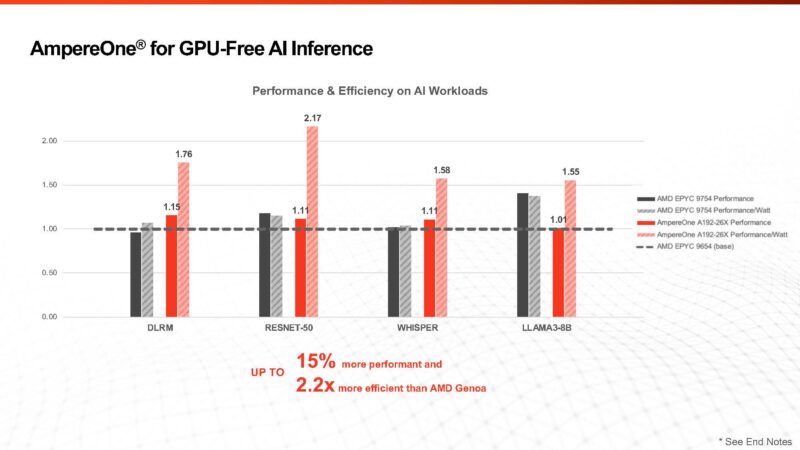
Another key area is that it can perform well for GPU-free AI inference. If you saw the Ampere AmpereOne Aurora 512 Core AI CPU, then you will know that it is the company’s focus. There is something notable about this in the end notes. Specifically, Ampere is using some custom tooling for its chips in the AI space.
Of course, there is a glaring omission. The Intel Xeon 6780E’s top score on SPEC CPU2017_int_rate is 1400 in a dual-socket configuration or around 700 per CPU, but that is using icc.
It feels like it is time to look at the end notes.
Taking a Look at Performance End Notes
Looking at the end notes is essential with these comparisons, especially since Ampere is de-rating the CPU2017 numbers based on a AOCC/ ICC to GCC conversion factor. The first one is end notes on energy forecasts.

The second end note is juicy. First, on the Ampere and AMD numbers, the company is using measured CPU package power during benchmark runs, but for the Intel Xeon Platinum 8592+ it is using TDP. Second, the company is using platform power assumptions rather than measured power at a given workload. Notably, the AMD platforms use 40W more based on 12-channel memory, not 8-channel. The AMD platforms have 50% more memory capacity, but that is a trade-off that one has to make with 8-channel and 12-channel platforms. We generally use 5W / DIMM, but we have seen others use 10W.
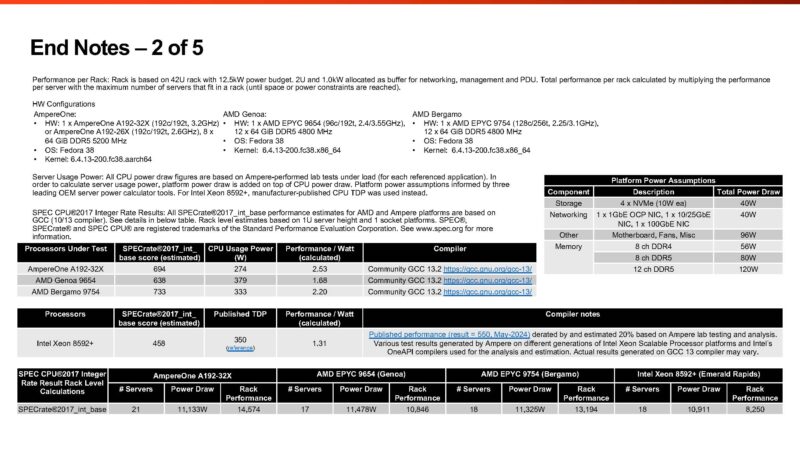
Ampere is also de-rating the Intel numbers by 20%. The estimated AMD EPYC 9754 GCC figures at 733 SPECrate2017_int_base is a 24.6% de-rating compared to the top published result we have seen at 972. Again, we have only seen dual socket Xeon 6780E results as official scores, but those hit 1400 on 2P systems. Using the best compiler comparison, the 144-core Intel Xeon 6780E should be about as fast as the 192-core AmpereOne A192-32X in integer workloads (~700 vs 702.)
On the containerized workload side, we have some very interesting results. The AMD EPYC 9754 uses 410W on NGINX, 383W on Redis, 363W on Memcached, and 374W on MySQL. Generally, the AMD EPYC Bergamo part uses up to its TDP maximum of 360W and stops, keeping clock speeds across cores limited. AMD CPUs tend to behave more like NVIDIA Grace CPUs and NVIDIA’s GPUs in this regard. Ampere appears to have observed different behavior in its test system. Something else stuck out here. The AmpereOne A192-26X and A192-32X should be 2.6GHz and 3.2GHz parts, respectively. In the NGINX test, the incremental 117W used to get the extra 600MHz is about a 45% increase in power consumption. It says “CPU Usage Power,” and based on the 2 of 5 End Note slide, it seems that ties to the CPU only, not the system. That is about a 24% performance increase for about a 45% power increase. The V/F curve might be stinging here. To be fair, the Intel Xeon 6766E is a 144-core part at 250W instead of 330W, and it does not scale linearly with power and performance gains to the 6780E either.
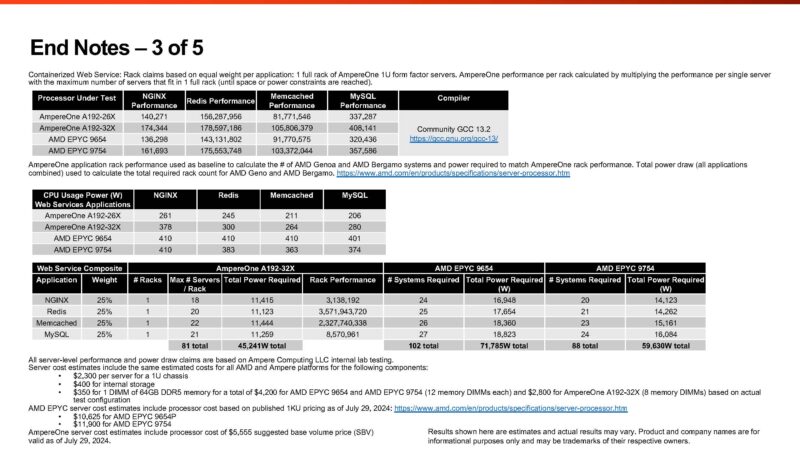
Also, the NGINX test is using more than 378W per A192-32X server, so it feels like that is indicating a big jump in power for that 600MHz as well as a big jump over the “usage power” in the Ampere AmpereOne Pricing and SKU List which used the SPEC CPU2017 figures.
In the footnote, the extra 4 DIMMs to fill memory channels are generally a good idea, but that adds to the cost without getting the benefit of having more capacity in these tests. More RAM can mean more applications or VMs running on a system. Many workloads and systems end up RAM capacity limited, so assigning cost without a way to also show the benefit of having more RAM should at least be noted.
On the AI workloads, bravo for Ampere using BF16 on AMD’s CPUs. The batch sizes seem to change, perhaps due to tuning for different platforms. The 128 batch size for AmpereOne in RESNET-50 versus 4 or 2 for AMD sticks out quite a bit.
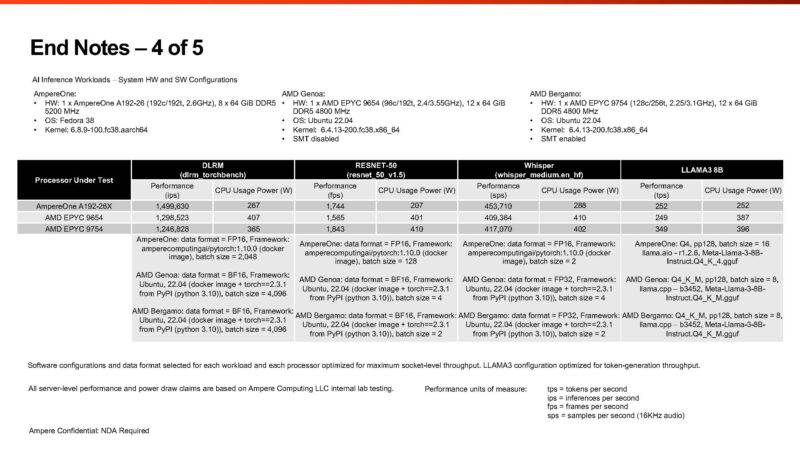
Two bits we should point out are that while Ampere is saying that it rejects the use of vendor-supplied compilers for things like SPEC CPU2017 and other workloads, it is using amperecomputingai/pytorch for its CPUs on the AI tests. The second worth pointing out is that if Intel AMX gets activated on AI workloads, it is usually a step function in performance in terms of throughput and latency. Latency was not noted in the AI testing End Note.
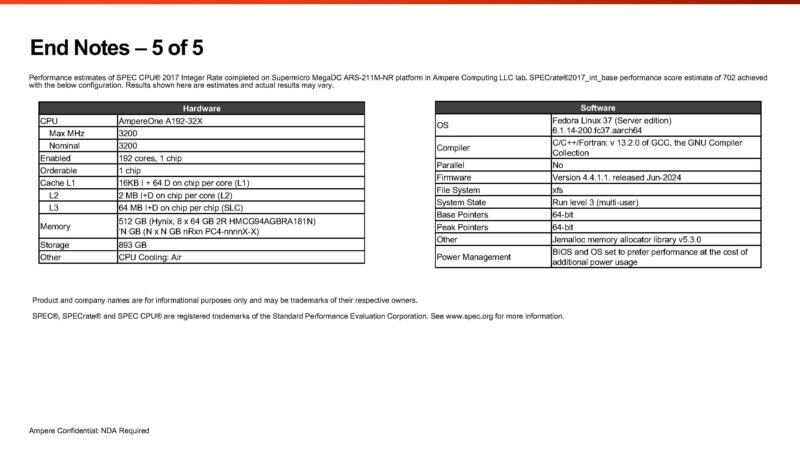
With End Note 5 of 5, we see the SPECrate2017_int_base estimate of 702 again. We hope to see this in official results soon. For some reference, a 128 core Ampere Altra Max has a SPECrate2017_int_base score of 356 submitted, so this is roughly doubling the best Ampere result if and when it is published. Another way to look at it is that Ampere Altra Max was about 2.78/ core while AmpereOne is about 3.66/ core.
Next, let us just summarize what we learned, and make some projections for the next-gen chips coming in the next few months.
Final Words
One of the most fascinating aspects of this is that AmpereOne seems to do well on AI workloads using FP16. At the same time, we do not see the company marketing AmpereOne floating point results heavily.
Another important aspect is that AmpereOne will see a 256-core, 12-channel part launch in 2024. That will increase the DIMM costs but also add a third more cores. It will, however, face stiff competition.
- The 256-core AmpereOne part, if it scaled performance on a per-core basis, would be about 936.
- If the 288-core Xeon E (Sierra Forest-AP) hits the same performance per core as the 144-core part, it will be around 1400 SPECrate2017_int_base.
- AMD EPYC Turin Dense is going to get a microarchitecture bump to Zen 5 and will add 50% more cores to 192 cores, so there is a good chance that part will be ahead of the Intel Sierra Forest-AP by a bit since even without a microarchitectural bump, a theoretical 192-core Zen 4c at the same power per core would be over 1450 (972 * 1.5 as many cores for the next-gen). If you assume even a 10% microarchitectural jump, that would put Turin Dense at 1600, and that might even be low.
- The above figures are using optimized compilers for SPEC CPU2017, not just GCC, so if you think all compute silicon should use a least common denominator a compiler of GCC, then you can apply de-rating factors to Intel and AMD. Again, remember that NVIDIA GPUs and other AI accelerators are the current data center revenue drivers and use custom compilers.
- Since power consumption is likely to rise for next-gen parts, the scaling may not be linear to what we have today. Frequencies may be altered to fit within the new TDP bands.
The next three quarters are going to be fascinating, to say the least. Hopefully, we get AmpereOne in the lab so we can show you more about the chip and systems. We know there are many folks that want to see more Arm architectures.


The focus of the SPEC benchmark suite is solving real computational problems as efficiently as possible. There are already rules for officially submitted results to avoid unrealistic optimisations, therefore it makes sense to use the best official scores to compare processors.
Thanks for noting when the slides don’t represent the best official scores for Intel and AMD. I find it a sad state of affairs when vendor comparisons are like this.
When manufacturers fumble with benchmarks like this it’s always to hide the fact that their products are not as attractive as the market wishes for. When Intel did this last the loss of market share to AMD started and accelerated.
Worse yet it treats potential buyers as if they’re stupid and can’t/won’t figure this out themselves.
Normalizing the figures Ampere provides to official scores and taking actual power figures where available there doesn’t really seem to be a case where they really offer a big benefit. So unless they’re going to compete on platform/CPU cost (which would hurt margins) I don’t see how these models are interesting at all.
Such a great analysis.
One theory is the low cost of Raspberry Pi familiarised developers with ARM and the rest is a consequence of the software.
Alternatively, Amazon became interested in ARM because they wanted the quality and control that comes with vertical integration. The troubles with the Meltdown side channel further accelerated the need for an architecture that could safely virtualize adversarial tenants in a public cloud.
Ampere provides on-premise data centers, colocation and other cloud builders with an answer to Graviton.
After classifying Xeon and Epyc as specialty hardware designed to run valuable legacy software, the comparisons in the slides should focus on Graviton 4 and maybe the Microsoft Azure Cobalt 100. Here the primary feature is secure virtualization with a guaranteed quality of service.
Are ampere one last gen instances publicly available? Google had announced adoption but afaik it never got publicly released. (I mean the CPUs that had their own design, not arm-licensed ones). They are not publicly available for purchase either, and there are no third party reviews for their performance to compare against their claims from last time around. I’m only guessing but it seems like last gen ampereone was underwhelming.