Today we have benchmarks of Amazon EC2 cloud compute instances. Recently we did an Amazon EC2 and Rackspace cloud compute for under $0.25/ hour comparison. As part of the feedback we received there, we benchmarked all of the Rackspace cloud compute instance types. The Amazon AWS EC2 cloud computing node types have many different compute and memory configurations. Today we are sharing benchmarks on all types of Micro, Standard and Second Generation Standard instances from Amazon. In the future, we will have these results as a baseline when looking at dedicated hardware so folks can make an informed decision on which infrastructure to run. On to the benchmarks!
Test Configuration
Each Amazon AWS EC2 cloud instance was powered by a different architecture. We spun up several instances until we got five instances using the same architecture. We then ran each benchmark five times on each of the five instances and averaged the results. We are only interested in CPU benchmarks this round so we are not doing heavy disk I/O tasks. Here are the Amazon EC2 instance types we used.
- Amazon AWS EC2 t1.micro – Intel Xeon E5430
- Amazon AWS EC2 m1. small – Intel Xeon E5645
- Amazon AWS EC2 m1.medium – Intel Xeon E5645
- Amazon AWS EC2 m1.large – Intel Xeon E5507
- Amazon AWS EC2 m1.xlarge – Intel Xeon E5645
- Amazon AWS EC2 m3.xlarge – Intel Xeon E5-2670
- Amazon AWS EC2 m3.2xlarge – Intel Xeon E5-2670
It should be noted that the underlying architecture does vary performance a bit. For example, the Intel E5430 is not going to have AES-NI instructions which may be a big impact for some users. Let’s take a look at what that means in terms of performance.
Amazon Cloud Benchmarks
We are utilizing our new Linux benchmark suite and Ubuntu Server 12.04 LTS to take a look specifically at the compute performance of these instances. We now have a fairly broad range of Amazon and Rackspace cloud instances benchmarked.
Hardinfo Performance
hardinfo is a well known Linux benchmark that has been around for years. It tests a number of CPU performance aspects.
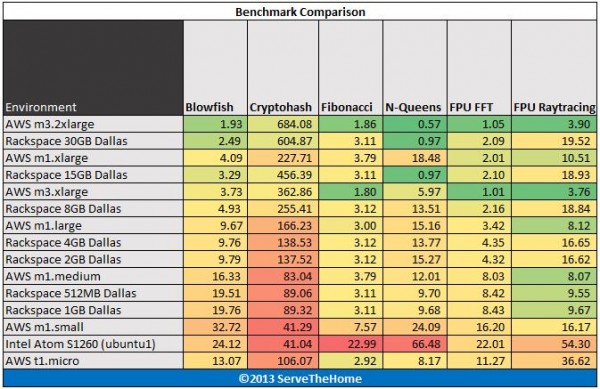
As one can see, the second generation Amazon EC2 instance, the m3.2xlarge does show some impressive performance. One can also see that the m3 instances are often out-performing the first generation m1.xlarge instance by a fairly solid margin.
UnixBench 5.1.3 Performance
UnixBench may be a defacto standard for Linux benchmarking these days. There are two main versions, one that tests single CPU performance on that tests multiple CPU performance. UnixBench segments these results. We run both sets of CPU tests. Here are the single threaded results:
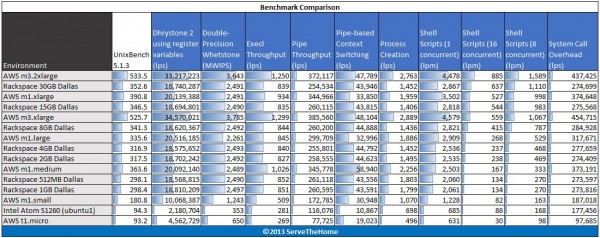
Again we are seeing the m3.xlarge instance outperform the m1.xlarge instance by a good margin.
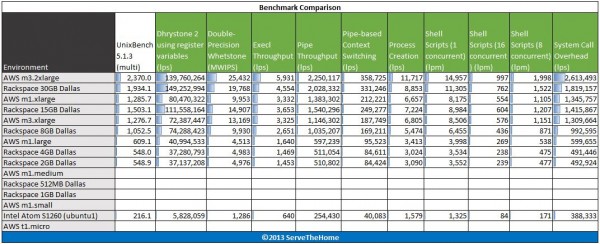
Again we see the Amazon EC2 instance generally fall into line as to what we would expect from them. We also see the Rackspace instances put up fairly comparable numbers. One thing to keep in mind, the standard pricing for the m3.2xlarge instance is $1/ hour as an on demand instance and is $2,978 up front and $0.246/ hour after that for a year ($5,133/ year). The reason this is important is because the data bars in the above are generated from the full set of results and as one can see, there have been much faster setups in the lab.
c-ray 1.1 Performance
c-ray is a very interesting ray tracing benchmark. It provides both consistent results and some clear separation. Ray tracing is generally a great multithreaded CPU benchmark. For this test we use both a simple 7500×3500 render and a more complex 1920×1200 render. Here are the Amazon EC2 cloud instances running the benchmark:
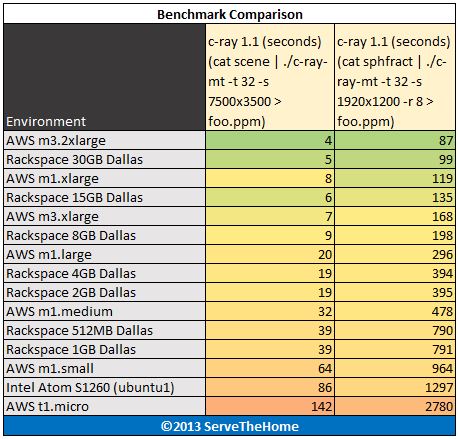
Here we are seeing the m1.xlarge instance perform a bit better than the m3.xlarge instance. The m3.xlarge instance has typically fared much better in single threaded tasks. Ray tracing tends to be a very good measure of “total compute” available so it is interesting to see the standard instance running a bit faster in the more complex render.
Crafty Chess Performance
Crafty is a well known chess benchmark. It is also one where we saw issues last time with the Phoronix Test Suite and running on ARM CPUs. Here are the Crafty Chess results from simply running “crafty bench”:
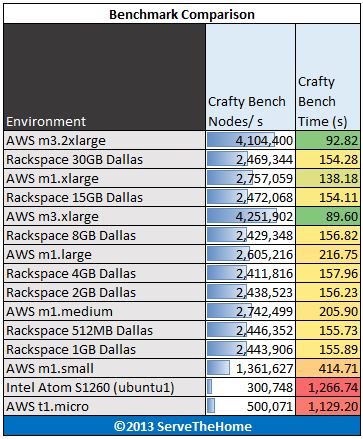
Again, we can see a major difference in the first generation (m1) and second generation (m3) Amazon EC2 cloud instances here. This benchmark tends to vary quite a bit based on the underlying CPU architecture.
Phoronix Test Suite Performance
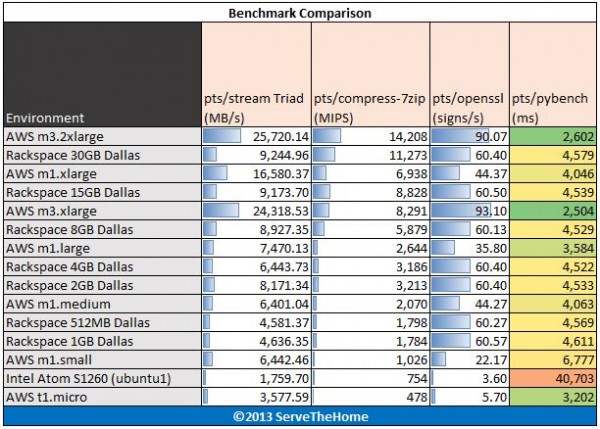
We are using four tests from the Phoronix Test Suite: pts/stream, pts/compress-7zip, pts/openssl and pts/pybench.
- STREAM by John D. McCalpin, Ph.D. is a very well known benchmark. So much so that the benchmark is highly optimized when results are presented. Vendors use the STREAM benchmark to show architectural advantages. Needless to say, oftentimes these results are hard to reproduce unless one is trying to squeeze every ounce of performance from a machine they are optimizing for. Since the rest of the industry does that, we are taking a different approach. One installation run across all systems. For this we are using the Phoronix Test Suite version pts/stream. Specifically we are using the lowest bandwidth figure Triad test to compare memory throughput.
- 7-zip compression benchmarks were a mainstay in our Windows suite so we are including it again on the Linux side as a compression benchmark.
- The pts/openssl benchmark is one we found a small issue on with the Amazon AWS EC2 t1.micro instance earlier. The micro instance had nice burst speed but fell off dramatically after that. Looping the test gave consistent results.
- Python is a widely used scripting language. In fact, it is arguably becoming even more popular these days so we decided to include a pyBench benchmark in the results.
Here are the results of the Phoronix Test Suite benchmarks:
Conclusion
Overall, there are two trends emerging. First, it is clear that Rackspace and Amazon are benchmarking their instances and pricing accordingly. Prices stay relatively close for each performance tier between the Amazon EC2 cloud and the Rackspace cloud. Moving beyond that distinction, the other major trend is that the Amazon EC2 second generation compute instances are generally significantly faster than the first generation instances. A final food for thought to readers, the results for dedicated server hardware is what generally pushes bars lower. The Intel Atom S1260 is a low power low cost compute node. Moving up to the dual socket and single socket Intel Xeon and AMD Opteron range is the force behind the data bars being so low. Stay tuned for more results but the above will be our cloud computing baseline to compare against dedicated hardware.




Awesome! Finally someone doing comparisons.
+1 Awesome!
Keep up the great work Patrick.
how cool you guys are benchmarking this stuff. not a complete set of results of course with no storage and networking tests. pure computational power good comparison with lots of data points
i just benched a m1.large and within 3%. cool i can reproduce these myself without compiling crazy stuff
can’t wait to see dedicated box results
Not that this is news to you, and not that you aren’t busy enough already Patrick, but I’d like to see detailed IO metrics included in your future benchmarks.
IO is the performance-limiting resource for many important cloud workloads and the different vendors currently use dramatically different storage infrastructure with dramatically different performance characteristics. A little sunlight shined on the differences between clouds should help improve IO performance across the industry and help us get a better return on our IAAS spending.
Very much on the docket. Don’t have a great storage I/O suite just yet. It is a bit more complicated because Amazon EBS from what I have seen can be very inconsistent. It is on the list though.
I want to see more clouds benchmarked