For first time cloud services buyers, one frustrating aspect of the experience is comparing one provider to another. Although one might assume that the hardware being used by cloud providers is going to be the fastest around, it turns out that this is not necessarily the case. Cloud providers are often times using 2-3 generation old server components. For those first time cloud buyers, today we are asking a simple question: What can the two largest cloud providers give users for $0.25/ hour? We are excluding other costs such as storage and bandwidth and focused solely on compute. Let’s see which platform is faster.
Comparing Amazon and Rackspace Cloud Instances
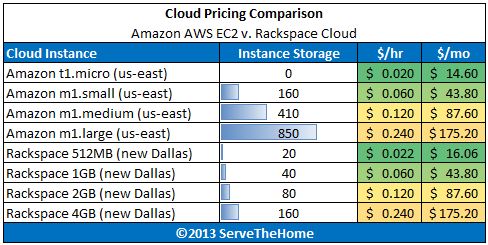
Here are the Amazon and Rackspace Cloud Instances used. The Amazon region is us-east whereas the Rackspace region is Next Generation Dallas. Each Rackspace instance was powered by an AMD Opteron 4170 HE, a two generations old predecessor to the AMD Opteron 4376 HE processor we recently benchmarked. The Amazon EC2 instance line-up was the same as last time. Here is a compute, RAM and cost breakdown. Note we are using a 730 hour month to calculate the monthly costs.
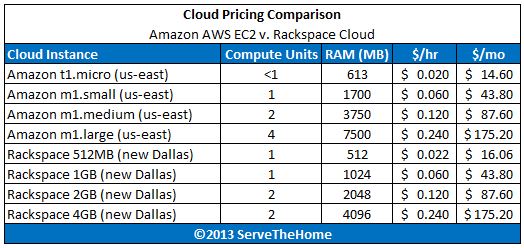
One can see, for the hourly price Amazon scales memory more aggressively. At the lower end of the spectrum, Rackspace seems to include more compute. The Rackspace 512MB does end up being $1.46 per instance month more than the Amazon t1.micro instance due to a $0.002 higher hourly cost. As we will see, it does depend on where one wants to optimize resources.
Hardinfo Performance
hardinfo is a well known Linux benchmark that has been around for years. It tests a number of different aspects of CPU performance.
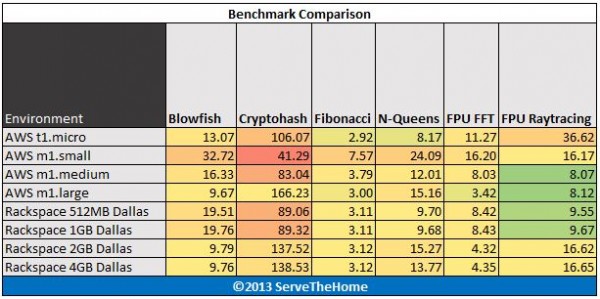
With the hardinfo benchmark we see a very mixed set f performance figures. For those wondering why the heatmap is heavily yellow-orange it is because the heatmap was built off of a larger set of results.
UnixBench 5.1.3 Performance
UnixBench may be a defacto standard for Linux benchmarking these days. There are two main versions, one that tests single CPU performance on that tests multiple CPU performance. UnixBench segments these results. We run both sets of CPU tests. Here are the single threaded results:

One can see that, interestingly enough, the Amazon AWS m1. medium arry was the fastest in most tests. Only the Amazon AWS EC2 m1.large and Rackspace 2GB and 4GB instances were capable of the multi-threaded benchmark. Here is what those results look like:

The Amazon EC2 m1.large instance shines here, outpacing Rackspace’s offering by a decent margin on every multi-threaded test along with its single threaded victory.
c-ray 1.1 Performance
c-ray is a very interesting ray tracing benchmark and provides both consistent results and some clear separation. Originally we were using a large 7500×3500 simple scene. that worked well for the low end machines but the dual Intel Xeon E5-2690 systems were running it in about a second. We then built a benchmark around a 1920×1200 but more complex scene. Here are the cloud instances running the benchmark:
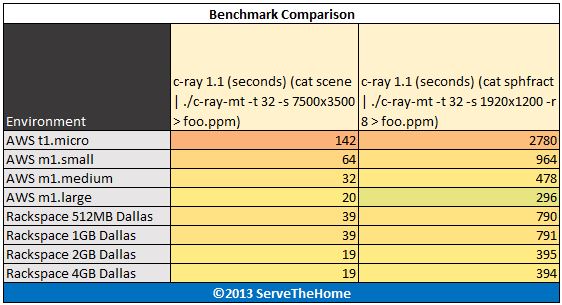
Here, in terms of raw compute the Rackspace 512MB instance is a clear price/ performance leader, handily beating both the Amazon AWS EC2 t1.micro and m1.small instances. A quick view above shows that the m1.small costs around 3x as much per hour versus the Rackspace 512MB instance.
Crafty Chess Performance
Crafty is a well known chess benchmark. It is also one where we saw issues last time with the Phoronix Test Suite and running on ARM CPUs. Another key consideration is that running on the default Amazon AWS AMI for Ubuntu 12.04 LTS will not install crafty from default Amazon repos. This one may end up getting removed from the final suite. We are running crafty in single threaded mode for the time being while we sort out how to build a standard for number of threads to run.
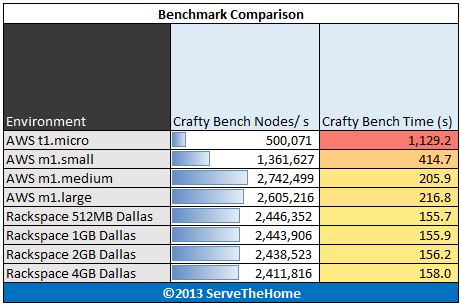
Crafty chess benchmark stresses the Amazon AWS EC2 t1.micro to its breaking point. The Amazon AWS EC2 m1.small instance also shows that its compute prowess is well below its peers. In single threaded mode, the other results are very similar between the different instances.
Phoronix Test Suite Performance
We are using four tests from the Phoronix Test Suite: pts/stream, pts/compress-7zip, pts/openssl and pts/pybench. STREAM by John D. McCalpin, Ph.D. is a very well known benchmark. So much so that the benchmark is highly optimized when results are presented. Vendors use the STREAM benchmark to show architectural advantages. Needless to say, oftentimes these results are hard to reproduce unless one is trying to squeeze every ounce of performance from a machine they are optimizing for. Since the rest of the industry does that, we are taking a different approach. One installation run across all systems. For this we are using the Phoronix Test Suite version pts/stream. Specifically we are using the lowest bandwidth figure Triad test to compare memory throughput. 7-zip compression benchmarks were a mainstay in our Windows suite so we are including it again on the Linux side as a compression benchmark. The pts/openssl benchmark is one we found a small issue on with the Amazon AWS EC2 t1.micro instance earlier. The micro instance had nice burst speed but fell off dramatically after that. Looping the test gave consistent results. Python is a widely used scripting language. In fact, it is arguably becoming even more popular these days so we decided to include a pyBench benchmark in the results.
Here are the results of the Phoronix Test Suite benchmarks:
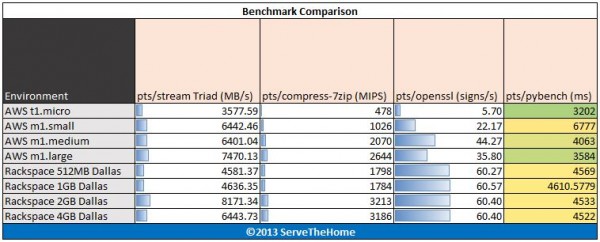
One can see that the dual AMD Opteron 4170 HE architecture fares fairly well here with Rackspace showing off performance advantages at most price points. The one anomaly seems to be the results from the five Rackspace 4GB runs. All were in the 6.3GB/s to 6.5GB/s range. Something to investigate further.
Conclusion
The numbers above took over 1,000 instances and test runs to gather. Cloud performance is not perfectly consistent so there is a margin of error that should be afforded to all results. Another important aspect is storage. Amazon does have more local storage (while pushing EBS storage) with most instances except the t1.micro which has none. Rackspace has been known to have much higher disk I/O in this class of cloud servers.
The companies differ in the scope of their add-on services as well as pricing. Suffice to say, there are many things to factor in. Hopefully the above benchmarks show what one can expect for under a quarter per hour.



Longtime reader. Coolest f*ing thing I’ve read on servethehome in awhile. Would have had no idea about this. Hope you expand the analysis to Azure and HP Cloud in the next few weeks. Also didn’t know monthly costs so high. Seems like a cheapo dedicated would be faster. Would be nice if you could provide a comparison.