Recently I had some performance previews of the Xeon E5-2687W which one could easily tell were a bit slanted. The E5-2687W is a 150w workstation part, and not something we would expect to see a lot of in single CPU configurations. Today we will look at some preview numbers from dual Xeon E5-2690 CPUs, Intel’s current LGA 2011 dual socket flagship product. Frankly, AMD needs to get nervous as these things are monsters and core count games are not going to cut it. If AMD had released competitive Opteron 6200 series Interlagos parts, in March 2012 the Intel Xeon E5 launch would be old news as they would have been released months ago and we would likely have lower Xeon E5-2600 series processor pricing.
Test Setup
For this test setup I used some pre-production parts. Compared to the earlier Intel Xeon E5 CPU samples I have seen, these seem to be very close to retail silicon. (In fact nearly identical to my retail Intel Xeon E5-2690 parts.)

- CPUs: 2x Intel Xeon E5-2690 CPUs (these seem to be very close to the shipping parts)
- Motherboard: Tyan dual socket LGA 2011
- Memory: 8x 4GB Kingston unbuffered ECC 1333MHz DIMMs
- SSD: Corsair Force3 120GB, OCZ Vertex 3 120GB 2x OCZ Agility 3 120GB
- Power Supply: Corsair AX850 850w 80 Plus Gold
- Chassis: Norco RPC-4220
- Cooling: 2x CoolerMaster Hyper 212 EVOs
Overall this ended up being a nice test platform but is not something robust enough that I think it is perfect. The Kingston memory used was only 1333MHz CL9 whereas we will be seeing a lot of 1600MHz CL11 soon. From what I can tell, the increased bandwidth will more than offset the increased latency.
One other note is that I recently purchased an Extech 380803 True RMS Power Analyzer and an NIST Calibrated Extech 407764 sound level meter plus a 15 ft extension cable so I can test from a different room. With the big lab upgrade, I hope to have some more useful environmental data on the site soon.
Performance Tests
I will start off this section by saying that the standard test suite was built to test 1-8 thread single CPU systems similar to the Sandy Bridge and Ivy Bridge Intel Xeon E3 series. With platforms like this one, I have been slowly altering the mix. Clearly, one would expect a different workload between this CPU and something found in a low-end, low-power server like a Pentium G630. Moving to the 16-64 core realm that is becoming the norm today, I think that it will become ever more important to develop a second test suite. For the purposes of this preview, the following should suffice but do expect that I will be altering this soon.
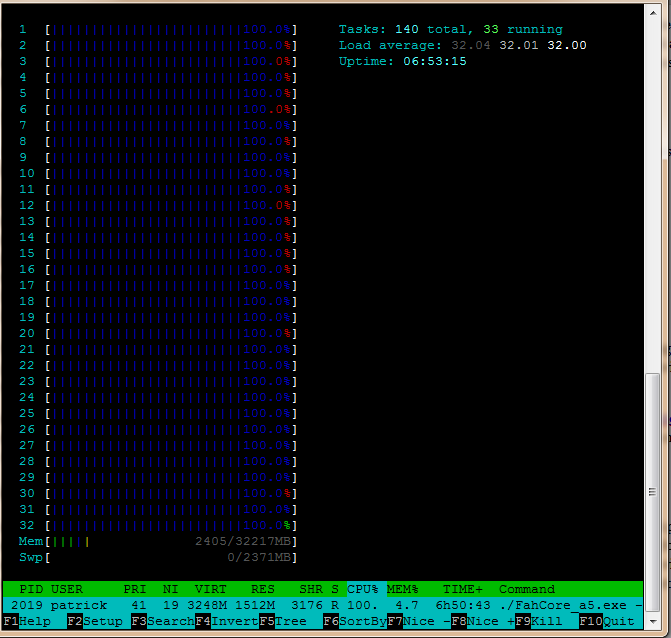
Yes… 32 pegged cores in a 2P system looks pretty good in htop. Clearly the Dual Xeon E5-2690 CPUs are all working. Let’s take a look at what that does for us.
Cinebench R11.5
I have been using Cinebench benchmarks for years but have held off using them on ServeTheHome.com because the primary focus of the site until the past few months has been predominantly storage servers. With the expansion of the site’s scope, Cinebench has been added to the test suite because it does represent a valuable benchmark of multi-threaded performance. I have had quite a few readers contact me about this type of performance for things like servers that are Adobe CS5 compute nodes and similar applications. Cinebench R11.5 is something that anyone can run on their Windows machines to get a relative idea of performance so I really like it.
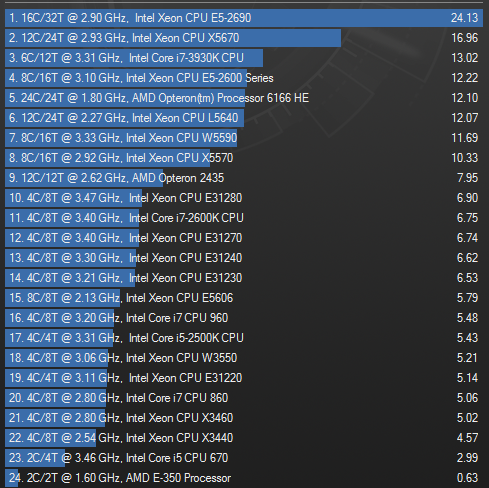
Sadly, I couldn’t find my results of the Quad Opteron 6172 and 6174’s so I do not have comparisons. Still, the 6166HE’s are twelve core CPUs and they get obliterated. Results are about twice as fast as the dual Xeon L5650 and Opteron 6166HE setups, and about as fast as the E5-2687W (noted above as the 3.1GHz E5-2600 series.) Even the dual 6C/12T X5670’s are left in the dust by the new 8C/12T chips running at about the same frequency. Yes, I did leave the AMD E-350 up there because from a performance/ watt perspective, the E5-2690 looks pretty good.
7-Zip Compression Benchmark
7-Zip is an immensely popular compression application with an easy to use benchmark.
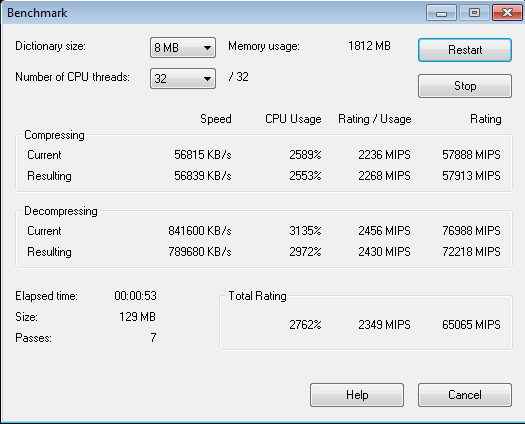
Good results, but was expecting more from the Xeon E5-2690’s after seeing the Xeon E5-2687W numbers.
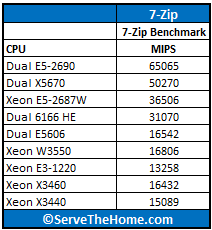
Overall, not so bad but I do wonder why the E5-2687W had similar compressing and decompressing scores while the 2P Xeon E5-2690 had a decent variance between the two.
TrueCrypt Encryption Benchmarks
With Intel’s focus on its AES-NI features TrueCrypt can look a bit skewed. Unlike some dubious drivers over the years that were optimized for benchmarks over real world application, Intel’s AES-NI feature does encompass the addition of specialized hardware. This specialized hardware has many practical uses and is becoming more supported. For example, users of Solaris 11 can utilize the AES-NI features to see much higher throughput on encrypted volumes. AMD has started offering AES-NI with their Bulldozer CPUs, and I will have those results added to future pieces. Without further waiting, here is the Dual Xeon E5-2690 series benchmark:
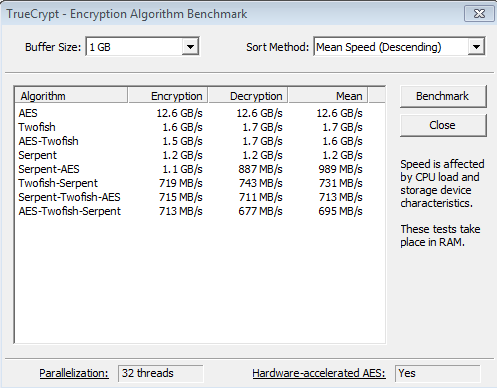
That is basically obliteration of the previous AES benchmark figures.

12.6GB/s is a fairly staggering figure. It makes AES encryption (that can take advantage of the extensions) very low cost from a CPU perspective in most applications.
Folding@Home
I am working to make Folding@Home a standardized benchmark, as it is a mature distributed computing client that runs very well in Linux. There is quite a bit of variability here, but the very interesting thing is that you can watch speeds scale very linearly with clock speed and cores (assuming the same architecture.) Times are generally measured in TPF which stands for Time Per Frame which measures the amount of time it takes to complete each frame. A bit of tweaking needs to be done for each setup as things like NUMA settings need to be tweaked for each setup for them to run optimally.
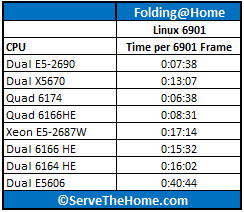
I did not get a 6903 work unit (very large) so I had to fall back to looking at 6901 units. Here, the dual socket Xeon E5-2690’s are competing with QUAD socket AMD Opteron 6100 series CPUs with twelve cores each (for a total of 48 cores.) One can see a pretty big jump in this.
Geekbench 2.27
I have been playing a bit with Geekbench under Windows and Linux lately. I will simply link the Ubuntu 10.10 Server (32772) and Windows 7 (39229) Geekbench scores. As of publishing this, the Windows 7 score is a top 15 Geekbench 2 result.
Conclusion
I will reserve final judgment for retail parts, but these chips are really good! I do think that this is in many ways an evolutionary processor release with a lot of platform enhancements that I will review later. One thing is obvious though, we need AMD to really step up. The Xeon E5 series was delayed because AMD did not pull off a spectacular Bulldozer launch. One thing we are sure of is that Intel’s new flagship CPUs are faster and more efficient than their predecessors, and we can say this with certainty, much unlike AMD’s Magny Cours to Interlagos transition.

Nice article, but how come the motherboard has no link or model name here? The embargo is already lifted…
Hey John, I have another review of the platforms, including one from Supermicro (I see you work there), going on for another site, and did not want to preempt that piece. This one is a Tyan 2P with SAS/ 4 x GbE, iKVM and 16 DIMM slots.
Can we get 6903 numbers? Cool idea using FAH as a benchmark
Thanks Patrick. Can you bench more of the E5 series?