Recently we have been investigating some of the higher-end SAS SSDs and now for a quick preview of the Seagate Pulsar.2 200GB SSD. We recently previewed anther SAS SSD, the SanDisk/ Pliant Lightning 206s. Unlike the Lightning, the Seagate Pulsar.2 200GB drive utilizes MLC rather than SLC technology. Like the SanDisk unit it utilizes a SAS interface and has a 5 year warranty. The 200GB unit can handle 10 full disk writes per day.
For all of the drives, including the Seagate Pulsar.2 drives we managed to find these on ebay for only $0.55/GB, with over three years of warranty left. That makes them in-line with some of the lower-end SATA drives one may use. We are doing a more in-depth comparison but this is at least some quick Enterprise SAS SSD v. Consumer SATA SSD data points.
Test Configuration
Since we are going to assume the use of already released hardware, we are using a legacy system for testing:
- Motherboard: Gigabyte GA-7PESH3
- Processors: Dual Intel Xeon E5-2690 (V2)
- SAS Controller: (onboard LSI SAS2008 in IR mode)
- RAM: 64GB DDR3L-1600MHz ECC RDIMMs
- OS SSD: Kingston V300 240GB
For those wondering, the LSI controller found onboard is the same as can be found in countless platforms and cards such as the IBM ServeRAID M1015 and LSI 9211-8i. We decided to use this controller since it is an extremely popular first-generation 6gbps SAS II controller. For those looking to build value SAS SSD enabled arrays, the LSI SAS2008 is likely going to be the go-to controller. A major point here is that we are using a SAS controller. This means that one cannot compare results directly to consumer-driven setups where a SATA SSD is connected to an Intel PCH port. There is a latency penalty for going over the PCIe bus to a controller to SAS. It also is a reason NVMe is going to be a game changer in the enterprise storage space.
One note on the SAS drives: SAS does operate at a higher voltage than SATA. That allows for better signal integrity and over longer cable lengths. In theory, the SAS drives are much better in remote disk shelves than their SATA counterparts. On the other hand, with lots of older-process NAND, a SAS interface and absolutely no intention of ever being used in a notebook, these drives use much more power than typical consumer SATA SSDs.
Seagate Pulsar.2 200GB SAS Quick Benchmarks
It is important, especially with SSDs not to take a single test result at face value. One should look at a few different tests to get an idea of how the drives perform in different scenarios. To this end, AS SSD benchmark, CrystalDiskMark, ATTO all show different facets of performance. These are the simple/ quick benchmarks. In the near future we will do some comparisons with longer term write comparisons and latency testing that are closer to enterprise workloads. We are using a few of our standard tests to do a quick comparison to some of the other drives that have passed through the lab recently.
AS SSD Benchmark
AS SSD is a solid benchmark that does not write compressible data to drives. The result is perhaps one of the best workstation SSD benchmarks available today.
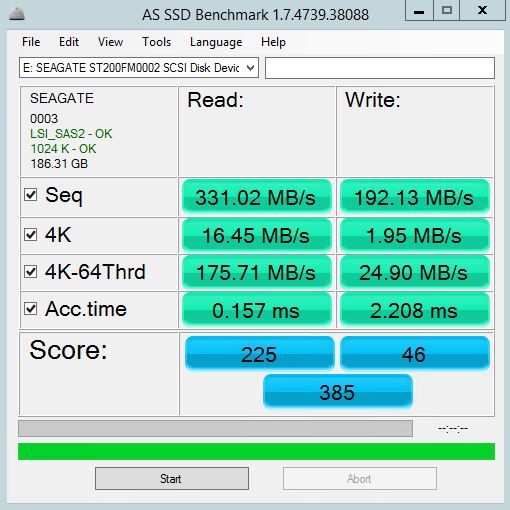
The Seagate Pulsar.2 drives were met with mixed market reception. One will also note that there are very few (if any) other benchmarks on these drives. One can quickly see from a performance perspective why very few of these were sampled to typical review sites.
CrystalDiskMark
CrystalDiskMark is another benchmark which gives non-compressible read/write numbers. This is in contrast to the ATTO Benchmark used by LSI/ Sandforce and its partners when they market a given solid state drive.
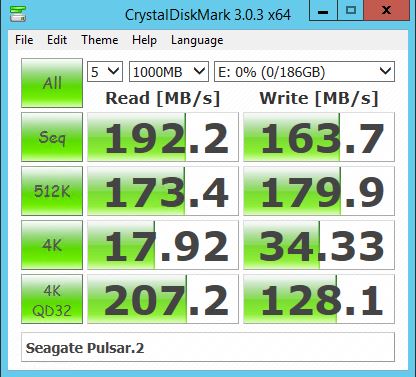
CrystalDiskMark shows a different picture. On one hand, sequential speeds are fairly low for a SAS2 6gbps drive. On the other hand, it is 4K speeds are significantly higher than we saw with AS SSD. The results of both tests were repeatable on both drives we have.
ATTO Benchmark
The value of the ATTO benchmark is really to show the best-case scenario. ATTO is known to write highly compressible data to drives, which inflates speeds of controllers that compress data like LSI/ SandForce does prior to writing on a given solid state drive.
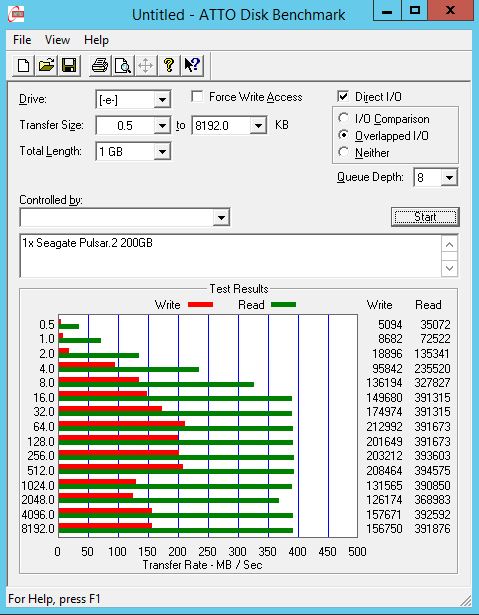
Like we have seen on some of the previous benchmarks, this is not the best result ever. The read numbers seem respectable. The write numbers show just how poor performance is on a sequential write basis. ATTO is generally significantly higher than other benchmarks so to see this type of performance across the benchmarks is poor.
Conclusion
Of course, these disks have 10 write per day endurance ratings. From what I heard these were released as a products incrementally better than enterprise SAS rotational disks. During the time these were likely in development, the market moved to much higher speed offerings. Seagate lost marketshare to other offerings at the time, such as the Pliant/ SanDisk Lightning drives we reviewed.




I never even looked but you’re right. There aren’t many/ if any benchmarks of these drives. It’s like Seagate intentionally decided not to sample them.