A very popular article from 2012 compared the entire lineup of Intel Xeon E5-2400 and Intel Xeon E5-2600 series processors. We received many questions about which processor are the best value. Value means something different to everyone. As a result, we created a simple metric, price/ (cores * clock speed). Our Intel Xeon E5-2400 and E52600 series processor comparison with prices quickly became a very popular reference piece. Today, we are doing something similar for the Intel Xeon E3-1200 V3 Haswell series processors.
Since the Intel Xeon E3-1200 V3 series utilizes the same native core architecture, performance scales predictably with cores and clock speed. The main variables then become the price on pays for the processor and the clock speed one receives in return. A few major caveats exist though. First, speed is not the only thing that matters. Unlike the Xeon E5-2400 and E5-2600 series, the Intel Xeon E3-1200 V3 series can have an onboard GPU. Second, TDP matters. The Intel Xeon E3-1200 V3 series is often meant to be deployed in many systems at a time. TDP is a major concern and the market pays a premium for lower power consumption. Third, Intel has features such as Hyper-Threading which can provide a major performance boost in some applications. Fourth, Intel’s Turbo boost can greatly change the processor’s speed therefore changing the price/ performance ratio.
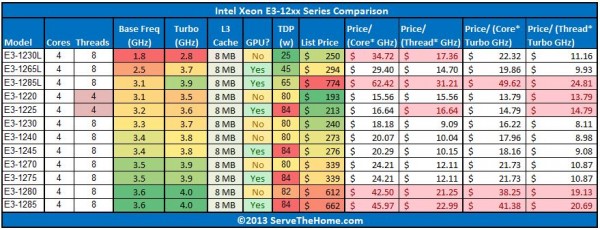
Here is a quick table with the new Haswell based Intel Xeon E3-1200 V3 series processors and the pricing breakdown:

The pink/ red highlighted cells are the ones that fall below the average of the Intel Xeon E3-1200 V3 series.
One can quickly notice a few key takeaways:
- The Intel Xeon E3-1280 series chips tend to be far below average on the Price / (Cores * frequency) ratios.
- On the other end of the spectrum we were surprised to see the Intel Xeon E3-1265L V3 perform so well falling below to just about average in the value metric while also offering an onboard GPU and a lower 45w TDP.
- The other key values seem to be in the Xeon E3-1230 V3, E3-1240 V3 and E3-1270 V3 range which is what we have seen in past generations.
- The Intel Xeon E3-1220 V3 we benchmarked and reviewed recently fares relatively well except in the Price/ (Thread * Turbo mode frequency) category.
Overall, this is a simple analysis on the Intel Xeon E3-1200 V3 series value. Haswell does provide other benefits, namely in operational costs which cannot be overlooked. Also, for some markets without IPMI 2.0 the onboard GPU is worth a significant premium not captured in the analysis. Hopefully this proves equally as useful as the previous version.


In the table, E3-1230L is given as 4c8t and 8mb L3, whereas it should be 2c4t and 4mb L3.
“On the other end of the spectrum we were surprised to see the Intel Xeon E3-1265L V3 perform so well falling below to just about average in the value metric while also offering an onboard GPU and a lower 65w TDP.”
The E3-1265L V3 has a 45W TDP: the E3-1285L V3 has a 65W TDP.
“In the table, E3-1230L is given as 4c8t and 8mb L3, whereas it should be 2c4t and 4mb L3.”
Intel’s ARK says 4c8t + 8MB – I think the table is correct. http://ark.intel.com/products/75053/Intel-Xeon-Processor-E3-1230L-v3-8M-Cache-1_80-GHz
The ymust have fixed it back to 45w now.
– ah, yes, I shoulda checked with ark for (more-)accurate info. (although it’s not always correct). I’d instead been using the table shown at:
http://www.servethehome.com/wp-content/uploads/2013/04/Intel-Xeon-E3-1200-V1-V2-and-rumored-V3-600×334.png
, that appears in the first post of the forum thread:
http://forums.servethehome.com/processors-motherboards/1816-intel-xeon-e3-1200v3-lga1150-haswell-processors-motherboards.html
Perhaps that table could be corrected if it’s wrong?
Hey, Patrick:
Your math is a little off. Because the TCO math would take operating cost into consideration as well.
What you are trying to optimize is TCO/performance.
So in first glance, you need to add in electricity cost:
(CPU cost + TDP*Dollar per Amp at the DataCenter)/(base Ghz*threads)
Use base Ghz because Turbo boost does not linearly* add performance/watt, so it is usually disabled by hyperscalers. And Threads should be number of real cores for HT disabled CPU, and number of real cores*1.3 for HT enabled CPU.
To additionally improve the TCO math, you should also add in the motherboard and datacenter space costs. The final math equation looks like this:
(Cost of 1U barebone + Cost of CPU + TDP*Dollar per Amp at DC*Years of expected operation + 1U of space at DataCenter per month* Years of expected operation) / (base Ghz*Threads where Threads = 1.3* real cores for HT enabled CPUs)