We recently published our quick benchmarks for a single Samsung SM1625 200GB SAS SSD. These follow four other SAS SSDs as part of our continued series on SAS SSDs we purchased between $0.50 and $0.60/ GB. We have been looking at the Samsung SM1625 in single port mode, however the figures for dual port mode are supposed to be higher. We are also looking at the performance of each of the drives in RAID 0. As a result, these are our quick benchmark results for two Samsung SM1625 200GB SAS SSDs in RAID 0.
We are continually growing this data set but here are the benchmark runs thus far:
Single SAS SSD Benchmarks
- Pliant/ SanDisk Lightning 206s 200GB SLC SAS SSD benchmarks
- Seagate Pulsar.2 200GB MLC SAS SSD benchmarks
- Pliant/ SanDisk Lightning 406s 400GB SLC SAS SSD benchmarks
- Smart Storage System/ SanDisk Optimus 400GB MLC SAS SSD benchmarks
- Samsung SM1625 200GB SAS SSD benchmarks
2 Drive RAID 0 Benchmarks
- 2x SanDisk Lightning 206s 200GB SAS SSD benchmarks
- 2x Seagate Pulsar.2 200GB SAS SSD benchmarks
- 2x Smart Storage System/ SanDisk Optimus 400GB MLC SAS SSD benchmarks
- 2x SanDisk Lightning 406s 400GB SAS SSD benchmarks
Our goal is to continue posting one more per week in-between other articles. We are also working on being able to add NVMe based SSDs to this as a comparison to state-of-the-art NAND storage. More on that shortly.
Test Configuration
Since we are going to assume the use of already released hardware, we are using a legacy system for testing across the test suite:
- Motherboard: Gigabyte GA-7PESH3
- Processors: Dual Intel Xeon E5-2690 (V2)
- SAS Controller: (onboard LSI SAS2008 in IR mode) and LSI SAS 3008
- RAM: 64GB DDR3L-1600MHz ECC RDIMMs
- OS SSD: Kingston V300 240GB
We are using a SAS controller so one cannot compare results directly to consumer-driven setups where a SATA SSD is connected to an Intel PCH port. There is a latency penalty for going over the PCIe bus to a controller to SAS. It also is a reason NVMe is going to be a game changer in the enterprise storage space.
Samsung SM1625 200GB SSD Quick Benchmarks
For our quick tests during this part of the series we will just provide the quick benchmarks with only a bit of commentary. The results should be fairly straightforward and the index of previous articles in this series (linked above) is a good resource to compare against.
AS SSD Benchmark
AS SSD is a solid benchmark that does not write compressible data to drives. The result is perhaps one of the best workstation SSD benchmarks available today.

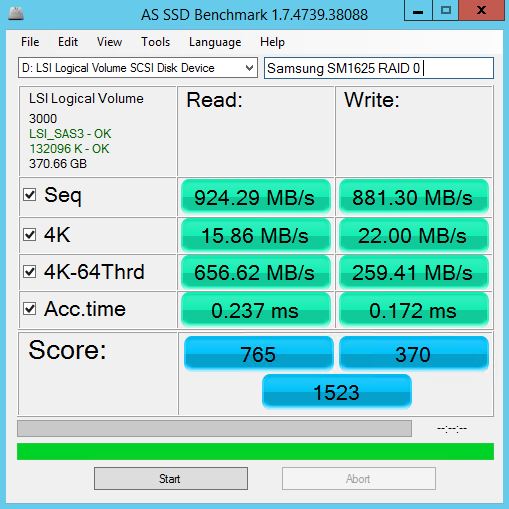
In AS SSD we can see fairly solid results. The sequential and 4K-64Thrd speeds are about twice what we saw with the single drive configurations. The real standout is the high-thread count 4K read speeds reaching over 650MB/s.
CrystalDiskMark
CrystalDiskMark is another benchmark which gives non-compressible read/write numbers. This is in contrast to the ATTO Benchmark used by LSI/ Sandforce and its partners when they market a given solid state drive.

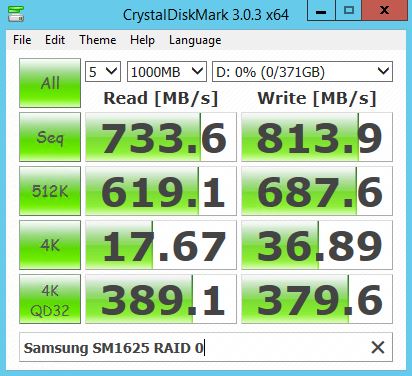
Like with AS SSD we see some very solid figures coming from these drives. Compared to the other similarly priced drives we have benchmarked recently, these are solid results.
ATTO Benchmark
The value of the ATTO benchmark is really to show the best-case scenario. ATTO is known to write highly compressible data to drives, which inflates speeds of controllers that compress data like LSI/ SandForce does prior to writing on a given solid state drive.

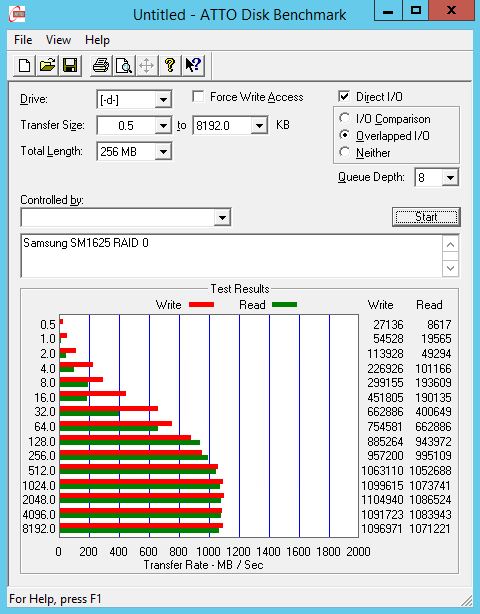
ATTO is the king of sequential performance and we see between 1GB/s and 1.1GB/s in sequential reads/ writes using the RAID 0 drives. In a dual ported configuration, it is likely we would get another 50-60% performance.
Conclusion
Overall the Samsung SM1625 drives are performing well in our RAID 0 benchmarks. As we are wrapping up some of the performance testing on this batch of SAS SSDs we will get summary figures posted soon. The Samsung SM1625 will perform well in those tests.


