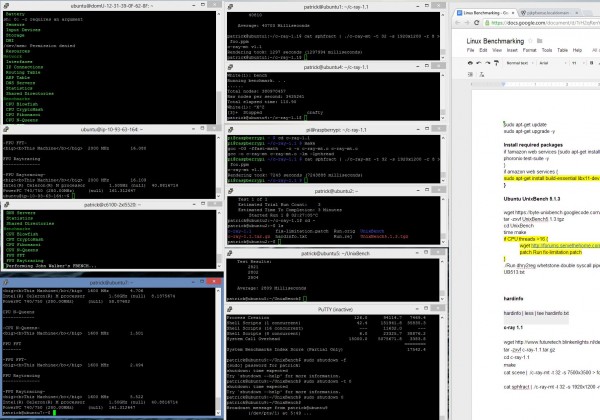
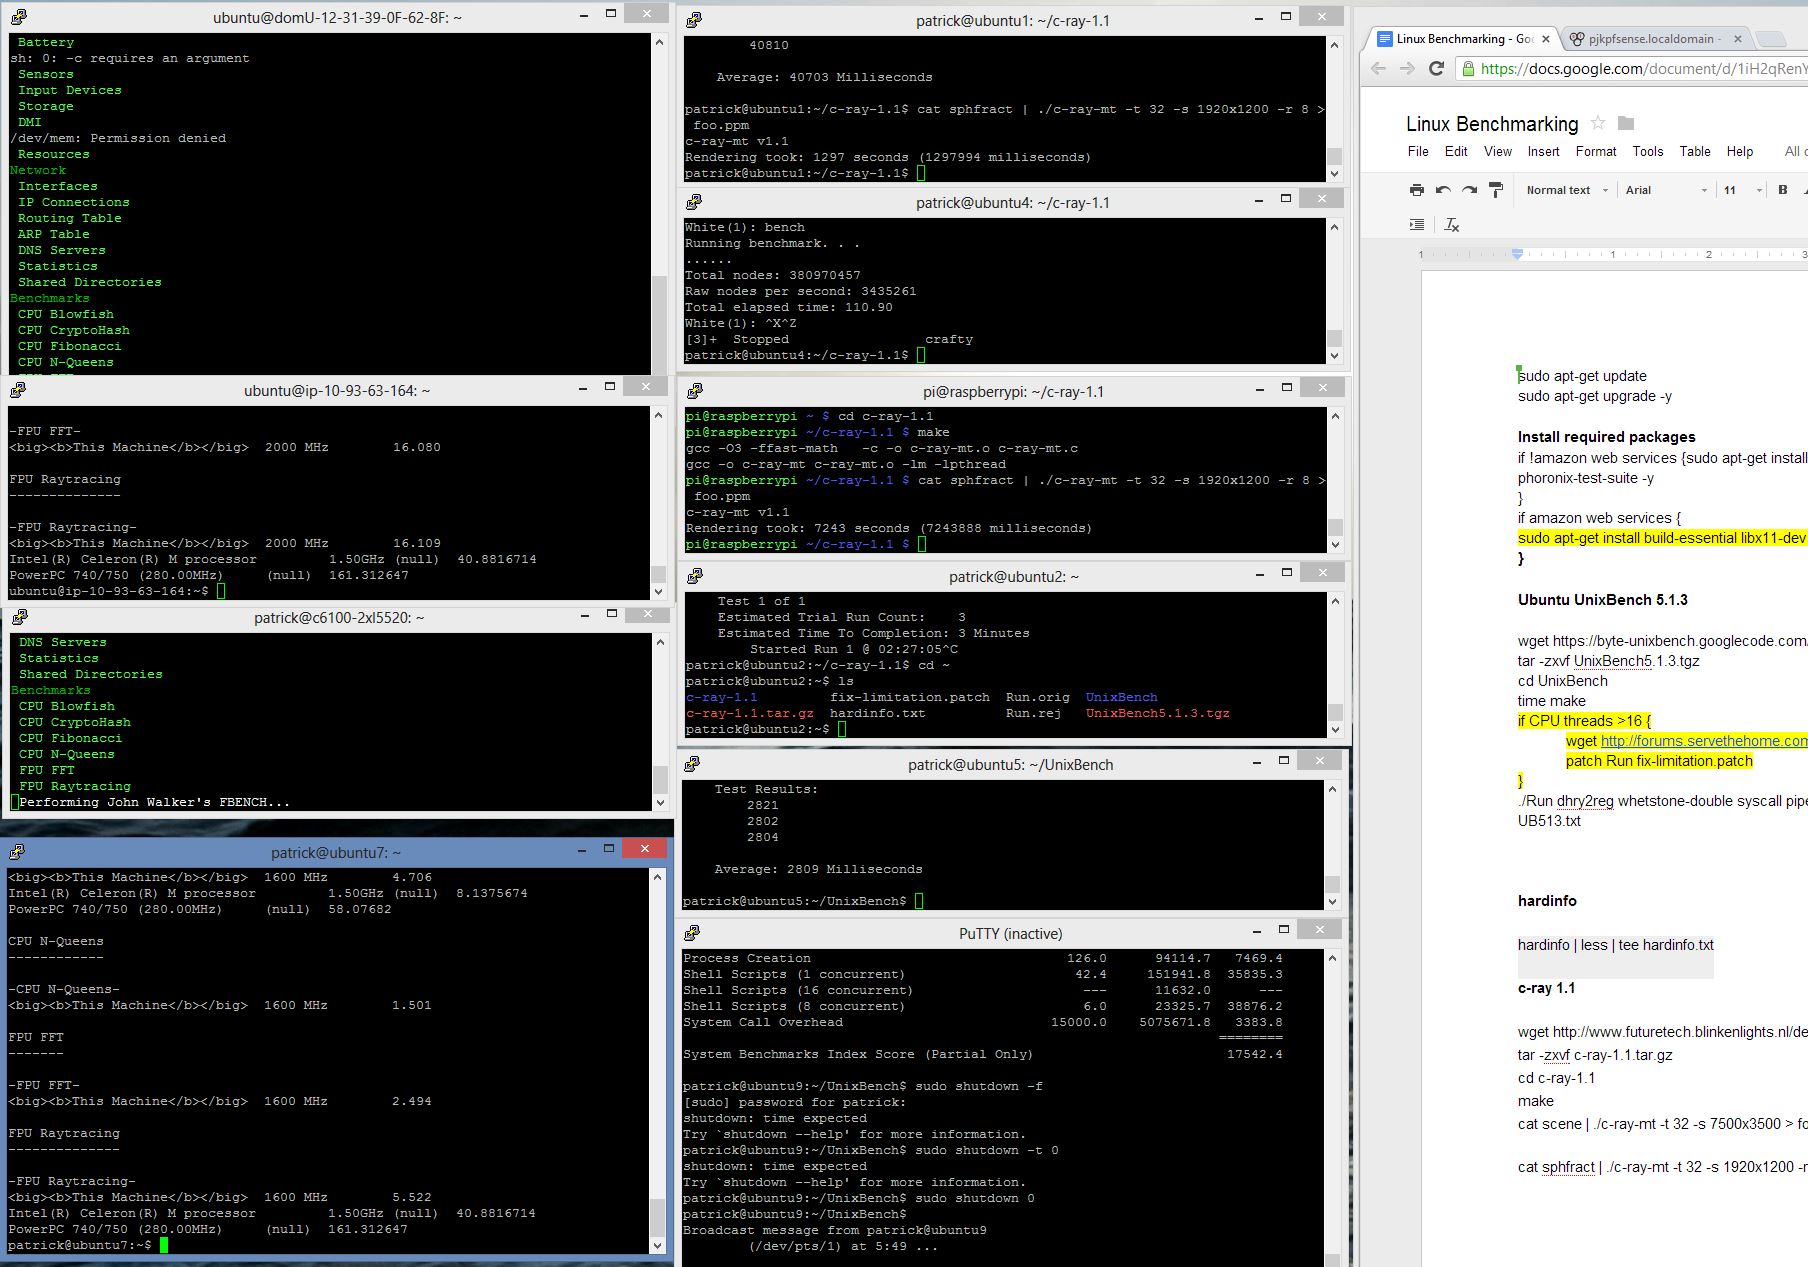
One area that has been in intense focus over the past week or so in the STH lab has been adding a Linux CPU benchmarking capability. There are absolutely tons of Linux benchmarks available. At the same time, benchmarking CPU performance in Linux is a bit tricky because oftentimes the guides and tutorials are written for one Linux distribution and quickly become dated. Furthermore, oftentimes benchmarking in Linux yields strange compilation errors that send users troubleshooting. This is a status update to let everyone know our recent progress in the space and to start sharing some initial results. It is also a request for feedback as we do want this to be a collaborative effort. In fact, we need help!
Over the past few weeks we have run over 10,000 benchmark runs on a significant number of recent systems. In terms of scope the lowest end system has been a Raspberry Pi and the highest-end system has been a dual Intel Xeon E5-2690 machine. In terms of performance deltas, we have seen deltas where the Raspberry Pi took over two hours for each test run while the dual Intel Xeon E5-2690 machine took 19 seconds.

Given the scop of the benchmarking we wanted to do Phoronix Test Suite was a leading candidate. It is generally a great platform to make benchmarking simple, but we found a few data points that suggested we needed to make our own benchmark suite. Two easy examples can be found when looking at both the Amazon EC2 t1.micro pts/openssl numbers and the Raspberry Pi pts/crafty results.
Example 1: OpenSSL Benchmark
The Amazon EC2 t1.micro instance’s “burst” CPU speed caused pts/openssl numbers to be inflated due to the initial run:
OpenSSL 1.0.1c:
pts/openssl-1.7.0
Test 1 of 1
Estimated Trial Run Count: 3
Estimated Time To Completion: 3 Minutes
Started Run 1 @ 17:49:55
Started Run 2 @ 17:50:17
Started Run 3 @ 17:50:39 [Std. Dev: 129.90%]
Started Run 4 @ 17:51:02 [Std. Dev: 138.46%]
Started Run 5 @ 17:51:24 [Std. Dev: 143.50%]
Started Run 6 @ 17:51:46 [Std. Dev: 146.74%]Test Results:
57
5.7
5.7
5.7
5.8
5.7
One can clearly see the first result is ten times higher than the others. Phoronix will re-do the test results until it achieves a lower standard deviation but if one loops the test the t1.micro will stay consistently in the 5.7 signs/s range and not revert back to 57. Amazon.com does mention this in their documentation. Suffice to say that is a very short burst of speed.
Example 2: Crafty Chess Benchmark
Also we saw an example of the pts/crafty chess benchmark finishing faster on a Raspberry Pi than dual CPU systems. We manually re-ran crafty to see a full log of the results and saw the following:
White(1): bench
Running benchmark. . .
.illegal position, no black king
bad string = “3r1k2/4npp1/1ppr3p/p6P/P2PPPP1/1NR5/5K2/2R5”
Illegal position, using normal initial chess position
.illegal position, no black king
bad string = “rnbqkb1r/p3pppp/1p6/2ppP3/3N4/2P5/PPP1QPPP/R1B1KB1R”
Illegal position, using normal initial chess position
.illegal position, no black king
bad string = “4b3/p3kp2/6p1/3pP2p/2pP1P2/4K1P1/P3N2P/8”
Illegal position, using normal initial chess position
.illegal position, no black king
bad string = “r3r1k1/ppqb1ppp/8/4p1NQ/8/2P5/PP3PPP/R3R1K1”
Illegal position, using normal initial chess position
.illegal position, no black king
bad string = “2r2rk1/1bqnbpp1/1p1ppn1p/pP6/N1P1P3/P2B1N1P/1B2QPP1/R2R2K1”
Illegal position, using normal initial chess position
.illegal position, no black king
bad string = “r1bqk2r/pp2bppp/2p5/3pP3/P2Q1P2/2N1B3/1PP3PP/R4RK1”
Illegal position, using normal initial chess positionTotal nodes: 14864526836704026544
Raw nodes per second: 171274
Total elapsed time: 0.43
The 0.43s was driven more by errors preventing successful completion rather than actual speed.
Key Principles for STH CPU Benchmarking in Linux
In creating the new CPU benchmarking suite we decided to use a few key principles to guide:
- The Linux CPU Benchmarks must be simple for a user to reproduce
- The Linux CPU Benchmarks must not be proprietary in nature
- A single stable platform must be used to limit variances
- Results need to be relatively consistent and “make sense” when looking at results
- Results need to be differentiated from others
- Need multiple components so that results are not too dependent on a single benchmark
- No extravagant customizations
At the end of the day, the goal is to just create a simple “anyone can use it” way to benchmark a system running Linux. There are plenty of sites doing benchmarking so we wanted to put a stake in the ground and provide a viewpoint on performance. The key here is making the suite accessible.
Stretch Goal: Web Server/ Web Cache Performance
One other aspect we are looking at is adding web server benchmarks and web caching benchmarks. Two examples we are loking at specifically are ngnix with Siege and twemperf.
Ngnix is quickly becoming a popular web server platform. STH moved most of its servers to ngnix in the past year and the numbers of sites running the lightweight server platform are growing. Apache would be very safe, but ngnix is the emerging platform. Siege is a great utility for testing a web server’s performance.
Also, many applications today can be accelerated using memcached. twemperf is a benchmarking utility to measure memcached server performance. For those wondering, at its core, memcached basically allows one to use a server node to cache requests in memory. In web applications, much of the workload is repetitive so having low latency caches can improve performance dramatically.
The hope is that we can add this into the main CPU test suite branch. If not, we may add a web application branch in the future. One of the other key aspects we are looking into is layering on “real world” applications. Many apache benchmarks in the past are using a very simple php page with very little going on. That is great except for blank php pages or php pages that say “Hello world!” are not entirely representative of workloads people may run in the real world.
What about I/O benchmarks?
Another great point that we have received feedback on multiple times in the last 24 hours. Filesystem I/O, for example, is a very important key indicator of overall server performance. Since we typically review and benchmark storage components separately from processors, the decision at this point is to keep these separate. With that being said, many users will see significant differences between AMD and Intel platforms today as well as the lower-cost Atom and ARM platforms emerging at the lower end of the segment. These will be addressed in time.
How can you help?
There are a few ways that you can help. First, we are working on scripting the Linux benchmarking suite right now. We will make it available for download once it is ready. If anyone is willing to test and share outputs that would be greatly appreciated. Second, if anyone has a script of ngnix installation + siege and/ or twemperf running that would be very helpful and may be able to get that into the current benchmark suite if we can incorporate it soon.
Also, for general status updates and to provide feedback we have a forum post on building the STH 2013 Linux Benchmark Suite.


If you want community-submitted benchmarks just make sure to integrate a “submit results to STH [y/n]” option in your script. We are lazy, if you want something from the community make it as easy as possible for us to cooperate.
I’d recommend making some sort of linux package (deb + a user-added repo), this way at least the distro is fixed across platforms. And you have easy deployment or maybe a live-usb stick, most of us have servers doing actual tasks, installing/configuring an OS would be too long an interruption I think.
Great idea Ewald! Thanks for the feedback. Likely the first version will be a script then will do a repo version. May also add the automated submission as the scripting matures.